Building an AWS Lambda Telemetry API extension for direct logging to Grafana Loki
In hybrid architectures, serverless functions work together with container solutions. Lambda logs have to be translated when you don`t choose CloudWatch Logs. The old way of doing this is through subscription filters using additional Lambda functions for log transformation. With the Lambda Telemetry API there is a more elegant, performant and cost-effective way. I am using Grafana Loki as a working example and show you how to build a working Lambda-Loki Telemetry APi extension.
Series Spy vs Spy - Serverless Telemetry
-
X-Ray: Getting started with X-Ray on Lambda with TypeScript/Python/Go
-
AWS Distro: AWS Distro for OpenTelemetry Lambda vs X-Ray SDK
-
Send Lambda traces with open telemetry: X-Ray vs Jaeger - Send Lambda traces with open telemetry
-
Telemetry API: Building an AWS Lambda Telemetry API extension for direct logging to Grafana Loki
Using a centralized Logging solution in hybrid environments
Using e.g. Grafana Loki as your centralized logging solution, where container and Lambda Functions should ship there logs is quite common.
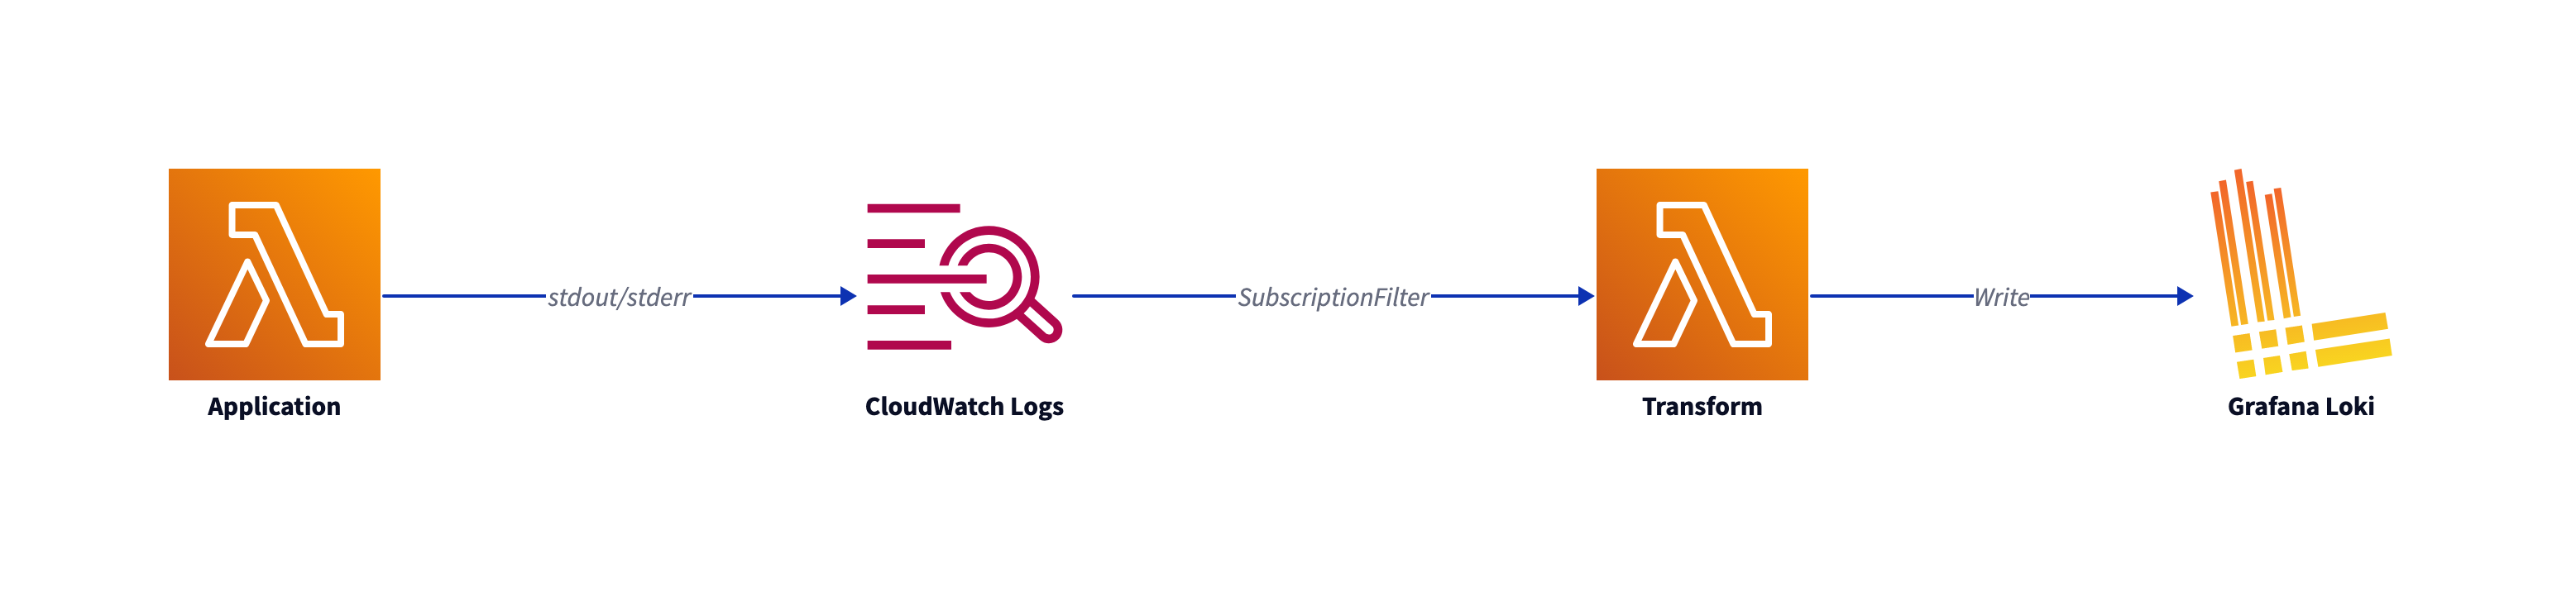
As described in the Lambda-Promtail documentation you have to use a CloudWatch Logs subscription filter to read Lamba logs. As serverless hero Yan Cui stated in this article, the Transform Lambda eats up your Lambda concurrency and adds additional costs. You could leverage that by using additional Kinesis streams, or you use the Lambda Telemetry API as an Lambda extension.
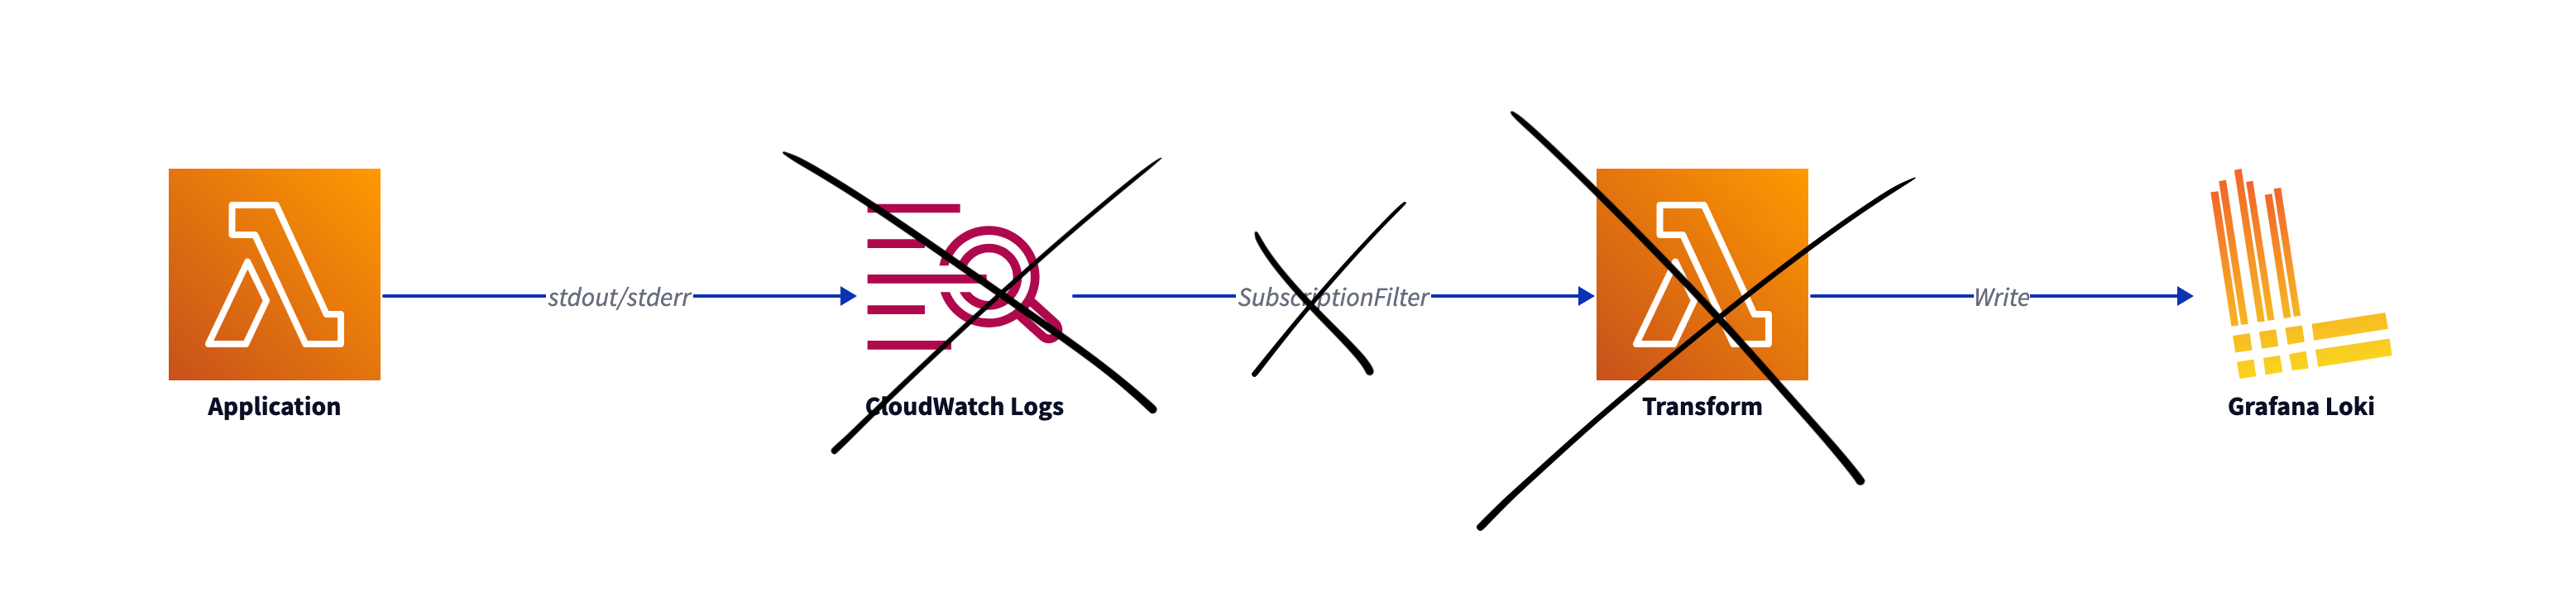
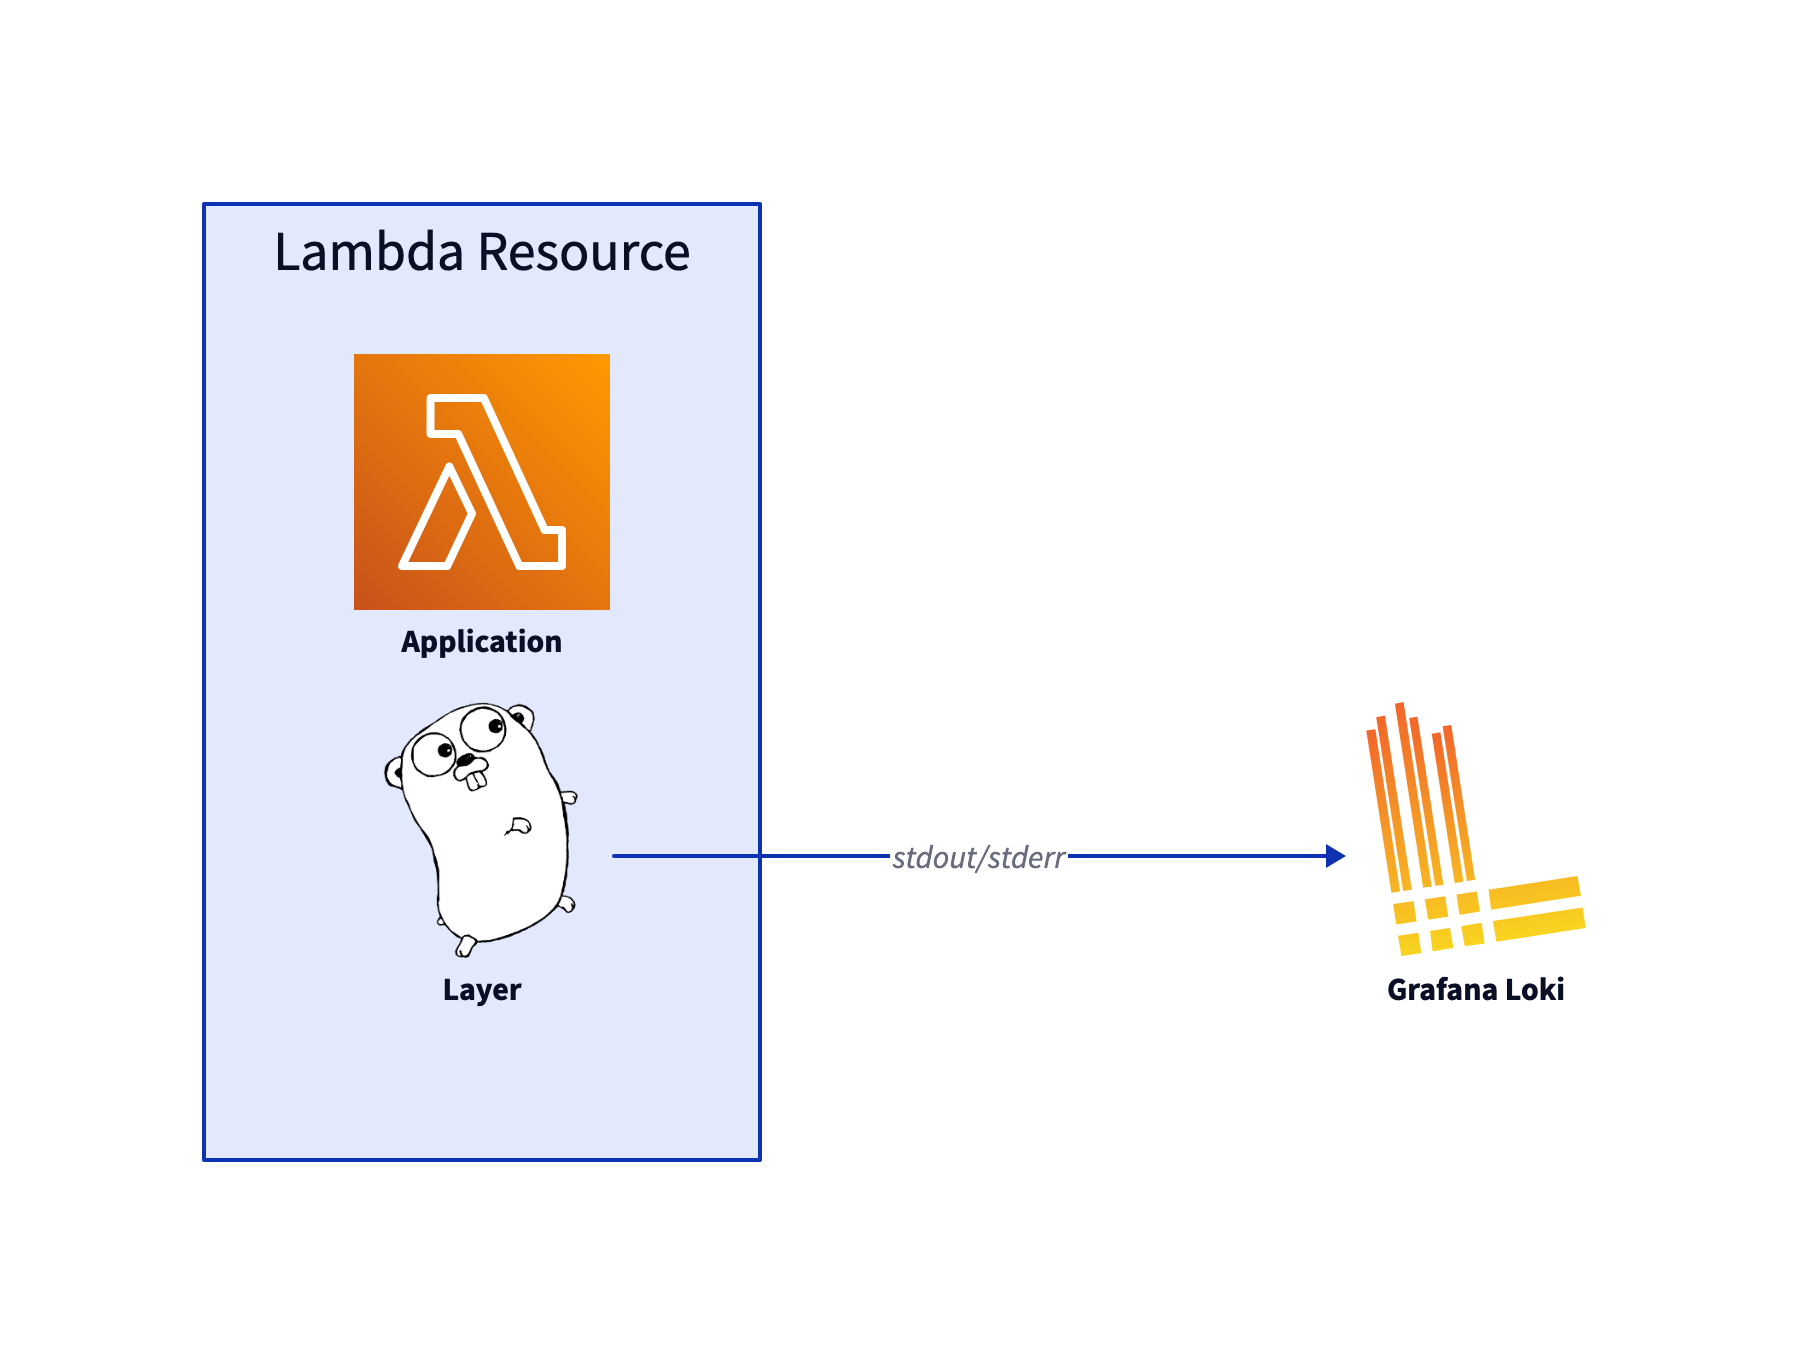
That makes this lighter architecture possible:
Introducing the Lambda Telemetry API
With the Lambda Telemetry API, Lambda extensions can directly receive telemetry data from Lambda.
Lambda Extensions
With the Lambda Extension API, you can use a Lambda Layer, which is called as an independent process in the execution environment and can continue to run after the function invocation is fully processed.
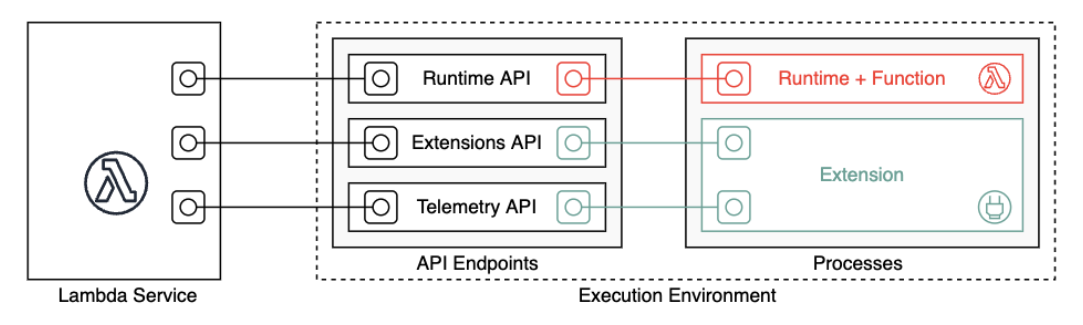
Lambda Telemetry API
The Telemetry API gets events from these telemetry streams:
-
Platform telemetry – Logs, metrics, and traces, which describe events and errors related to the execution environment runtime lifecycle, extension lifecycle, and function invocations.
-
Function logs – Custom logs that the Lambda function code generates.
-
Extension logs – Custom logs that the Lambda extension code generates.
An extension app can get all logging output from a Lambda Function by subscribing to the Function events. The event types are defined in the developer guide.
By not subscribing to Platform events, you will not get events like the platform.start event, which creates the START log entries. You will only get the output from the Lambda Function itself. This way, the logs will be better parseable.
Grafana Labs Loki
The Grafana tools are often used in containerized environment. So I will build the extension for Grafana Loki, which is the logging solution.
Fun fact: My first approach was using parseable. But it turned out that parseable is not capable of working with IAM roles at the moment.
From Lambda Telemetry API Event to promtail
You can push events into Loki with the promtail api or the newer Loki api. The api is described in the documentation. I will use the /api/prom/push call.
The Extension Code
As AWS states in Creating extensions using the Telemetry API that it is recommended to use a compiled language such as Golang or Rust. So of course, I am using GO.
There are some extension examples github. I am using go-example-telemetry-api-extension as a starting point. You can see the code in my Lambda-Telemetry-API-Loki repository.
Who’s calling who
The extension works in these main steps:
- Register the extension with Extensions API
- Start an HTTP listener to receive events
- Subscribe to any of the types of Platform, Function, Extension
- Receive events and dispatch them to the target, here Loki
1) Register
This is done via the Register call of the extension api.
See extensionApi/client.go:
baseUrl := fmt.Sprintf("http://%s/2020-01-01/extension", os.Getenv("AWS_LAMBDA_RUNTIME_API"))
//...
const action = "/register"
url := e.baseUrl + action
///
httpRes, err := e.httpClient.Do(httpReq)
2) Listener
The struct is composed of an HTTP server and a queue. For performance reasons, events are not directly pushed to Loki but are queued up to the DISPATCH_MIN_BATCH_SIZE environment variable.
The Lambda extension gets its environment from the Lambda Function, so you set the values in the Lambda Function API.
type TelemetryApiListener struct {
	httpServer *http.Server
	// LogEventsQueue is a synchronous queue and is used to put the received log events to be dispatched later
	LogEventsQueue *queue.Queue
}
3) Subscribe
In telemetryApi/client.go the function Subscribe calls the baseUrl of the telemetry extension:
baseUrl := fmt.Sprintf("http://%s/2022-07-01/telemetry", os.Getenv("AWS_LAMBDA_RUNTIME_API"))
The possible parameters are described in the Lambda Telemetry API reference. For example, if you expect high-volume data, you should tune the batch size and the buffering parameter of the subscribe call.
Now that we have an extension, we need to build it & install it to Lambda Functions.
Build & Install the Telemetry Layer
In the repository I build the layer binaries with the help of the great taskfile:
cd loki_extension
task build
That calls:
GOOS=linux GOARCH=amd64 go build -o dist/extensions/grafana-loki-extension main.go
Which creates an executable binary for amd64 architecture. If you use arm architecture, you have to change the GOARCH variable. The created binary is zipped and published as an Lambda Layer.
To set the Layer ARN in the Lambda Function, I store the ARN.
With the extension, you define the compatible runtimes --compatible-runtimes for the Lambda Layer.
The whole call:
ARN=`aws lambda publish-layer-version --layer-name "grafana-loki-extension" --region eu-central-1 --compatible-runtimes nodejs16.x go1.x python3.9 --zip-file "fileb://extension.zip" --query "LayerVersionArn" --output text` && echo $ARN
Output:
arn:aws:lambda:eu-central-1:012345679812:layer:grafana-loki-extension:1
Now the layer is installed in the current AWS account. We can use the Layer in Lambda Functions without changing one line of the function code.
The Test Architecture Setup
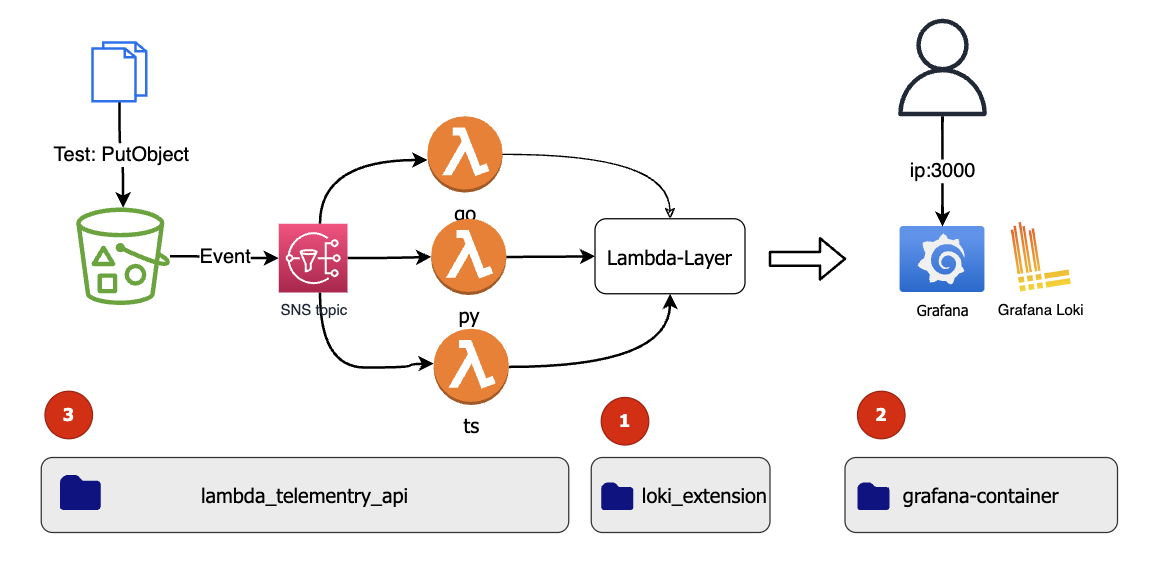
The setup has three components:
- The telemetry layer with the Loki extension
- A Grafana Loki containers and other Telemetry tools as docker-compose setup
- Test Lambda Functions for the Telemetry API written in TypeScript, Python and Go
1) The telemetry Layer
This is the Layer I installed. For the Lambda Function you reference the ARN:
arn:aws:lambda:eu-central-1:012345679812:layer:grafana-loki-extension:1.
2) Grafana Tools
I am using a setup from the book Cloud-Native Observability with OpenTelemetry
This is not for production. For better setups, see the other articles of this series.
The setup includes:
- The Opentelemetry-collector
- Prometheus
- Loki
- Promtail
- Grafana
For a test environment, we start the containers on a Cloud9 Server in a public network.
2.1. Create a Cloud 9 environment
2.2. Add rules to the security group of the instance open to your IP, and open the Loki/Promtail api for Lambda IP addresses like:
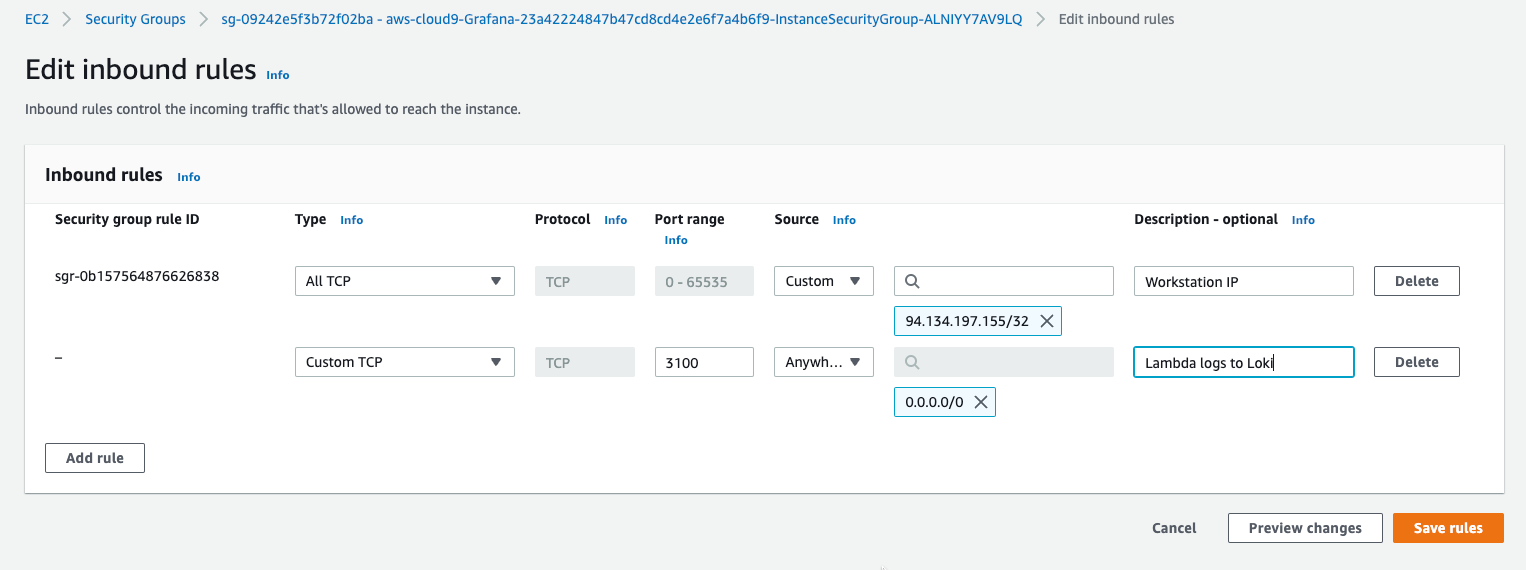
For production you would have an authentication setup or/and Lambda in a VPC in a private subnet, so that you got fixed IPs.
2.3. Install Docker Compose on Cloud9:
sudo curl -L "https://github.com/docker/compose/releases/download/1.23.1/docker-compose-$(uname -s)-$(uname -m)" -o /usr/local/bin/docker-compose
sudo chmod +x /usr/local/bin/docker-compose
docker-compose --version
Output:
AWSReservedSSO_AWSAdministratorAccess_b58ba5bc1d953bb1:~/environment $ docker-compose --version
docker-compose version 1.23.1, build b02f1306
2.4. Clone the repo:
git clone https://github.com/megaproaktiv/Lambda-Telemetry-API-Loki.git
cd Lambda-Telemetry-API-Loki/grafana-container/
2.5. Start the Grafana environment:
docker-compose up
Output:
Creating network "grafana-container_observability" with the default driver
...
2.6. Open Grafana
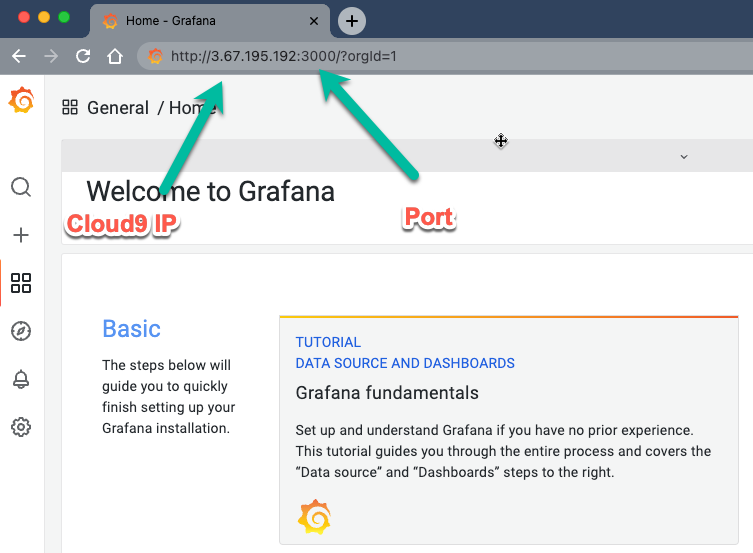
Now the Grafana tools should be running, so open the public IP of your Cloud9 instance on port 3000.
Example: http://3.67.195.192:3000/?orgId=1
You should see something like:
3) Lambda Functions
In the directory lambda_telementry_api the Lambda Resources are defined with CDK.
If you use another layer version, you have to adapt the url in lib/lambda_telementry_api-stack.ts:
const extensionName = "grafana-loki-extension"
const layerVersion="1"
const loki_ip="3.67.195.192"
const distpatch_min_batch_size = "10"

const lambdatelematryApiLayerArn = "arn:aws:lambda:"+region+":"+account+":layer:"+extensionName+":"+layerVersion
const ltaLayer = lambda.LayerVersion.fromLayerVersionArn(this, "ltalayer", lambdatelematryApiLayerArn)
Also set the Loki IP from the last step.
Make sure you got docker running and deploy the CDK stack with:
task deploy
This will build all Lambda Functions and deploy them.
Now we have established a simpler logging setup:
Test the setup
The Lambda functions take all PutObject events from an S3 Bucket and write the object key into a DynamoDB.
There is a test script inside the lambda_telementry_api directory, which puts object in the created bucket:
/test/traffic.sh
Stop the script after approx. 20 copy calls.
The output looks like:
So 12 Feb 2023 14:42:17 CET
upload: ./readme.md to s3://lambdatelementryapistack-incoming0b397865-hjxvhc2842jy//test-4-0-0-
So 12 Feb 2023 14:42:18 CET
upload: ./readme.md to s3://lambdatelementryapistack-incoming0b397865-hjxvhc2842jy//test-4-0-1-
The CloudWatch logs of the Lambda Function now show the output from the extension also. The log level is set to verbose, so you can see many events:
Log events from the extension
time="2023-02-12T13:42:18Z" level=info msg="[main] Starting the Telemetry API extension" pkg=main
time="2023-02-12T13:42:18Z" level=info msg="[main] Registering extension" pkg=main
time="2023-02-12T13:42:18Z" level=info msg="[client:Register] Registering using baseURLhttp://127.0.0.1:9001/2020-01-01/extension" pkg=extensionApi
time="2023-02-12T13:42:18Z" level=info msg="[client:Register] Registration success with extensionId 5b43e095-292c-4d3c-94d0-be9cea43c78d" pkg=extensionApi
time="2023-02-12T13:42:18Z" level=info msg="[main] Registation success with extensionId5b43e095-292c-4d3c-94d0-be9cea43c78d" pkg=main
time="2023-02-12T13:42:18Z" level=info msg="[main] Starting the Telemetry listener" pkg=main
time="2023-02-12T13:42:18Z" level=info msg="[listener:Start] Starting on addresssandbox:4323" pkg=telemetryApi
time="2023-02-12T13:42:18Z" level=info msg="[main] Subscribing to the Telemetry API" pkg=main
time="2023-02-12T13:42:18Z" level=info msg="[client:Subscribe] Subscribing using baseUrl:http://127.0.0.1:9001/2022-07-01/telemetry" pkg=telemetryApi
The queue waits for shutdown or if the distpatch_min_batch_sizeis reached:
time="2023-02-12T13:58:16Z" level=info msg="[listener:http_handler] logEvents received:1 LogEventsQueue length:2" pkg=telemetryApi
time="2023-02-12T14:02:18Z" level=info msg="[listener:http_handler] logEvents received:2 LogEventsQueue length:11" pkg=telemetryApi
time="2023-02-12T14:02:18Z" level=info msg="[dispatcher:Dispatch] Dispatching :11 log events" pkg=telemetryApi
Log events from the Platform
INIT_START Runtime Version: python:3.9.v16	Runtime Version ARN: arn:aws:lambda:eu-central-1::runtime:07a48df201798d627f2b950f03bb227aab4a655a1d019c3296406f95937e2525
END RequestId: 1af7f8ab-94e7-4a7a-b3c8-db06eedf874b
REPORT RequestId: 1af7f8ab-94e7-4a7a-b3c8-db06eedf874b	Duration: 132.32 ms	Billed Duration: 133 ms	Memory Size: 1024 MB	Max Memory Used: 83 MB	Init Duration: 783.94 ms
Log events from the Function
The Python Lambda lambda_telementry_api/lambda/py/app.py logs the DynamoDb Response:
    for record in message['Records']:
        itemKey = record['s3']['object']['key']
        response = putDynamoItem(environment['Table'], itemKey)
        print(response)
In the cloudwatch logs we see:
{'ConsumedCapacity': {'TableName': 'items', 'CapacityUnits': 1.0}, 'ResponseMetadata': {'RequestId': 'DPKG7GR6V8G0SA2ATEPR2M4UB3VV4KQNSO5AEMVJF66Q9ASUAAJG', 'HTTPStatusCode': 200, 'HTTPHeaders': {'server': 'Server', 'date': 'Sun, 12 Feb 2023 13:42:19 GMT', 'content-type': 'application/x-amz-json-1.0', 'content-length': '62', 'connection': 'keep-alive', 'x-amzn-requestid': 'DPKG7GR6V8G0SA2ATEPR2M4UB3VV4KQNSO5AEMVJF66Q9ASUAAJG', 'x-amz-crc32': '2296128304'}, 'RetryAttempts': 0}}
Now we should see the same event in Grafana.
Query the Function logs in Grafana Loki / Grafana
Loki works with labels. To find the Lambda Functions, the promtail client is initialized with the Function name as tag in loki/promtail.go:
	function_name = os.Getenv("AWS_LAMBDA_FUNCTION_NAME")
	labels := "{source=\""+source_name+"\",function=\""+function_name+"\"}"
	lokiIp := os.Getenv("LOKI_IP")
	if len(lokiIp) == 0 {
		panic("LOKI Ip undefined")
	}
	conf = promtail.ClientConfig{
		PushURL:            "http://"+lokiIp+":3100/api/prom/push",
		Labels:             labels,
		BatchWait:          5 * time.Second,
		BatchEntriesNumber: 10000,
		SendLevel: 			promtail.INFO,
		PrintLevel: 		promtail.ERROR,
	}
All Lambda Function event are tagged as Source=Lambda
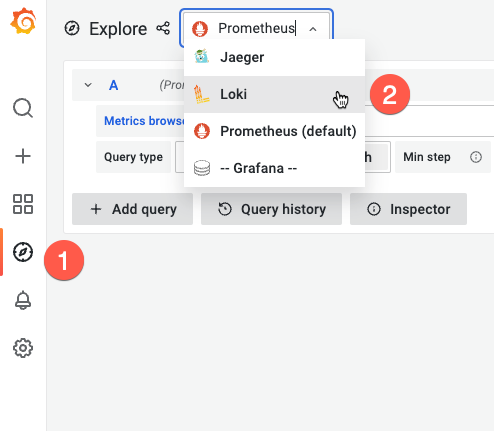
In the Grafana browser start Loki (2) with the explore icon (1):
So after the first events arrived in Loki, you see these labels:
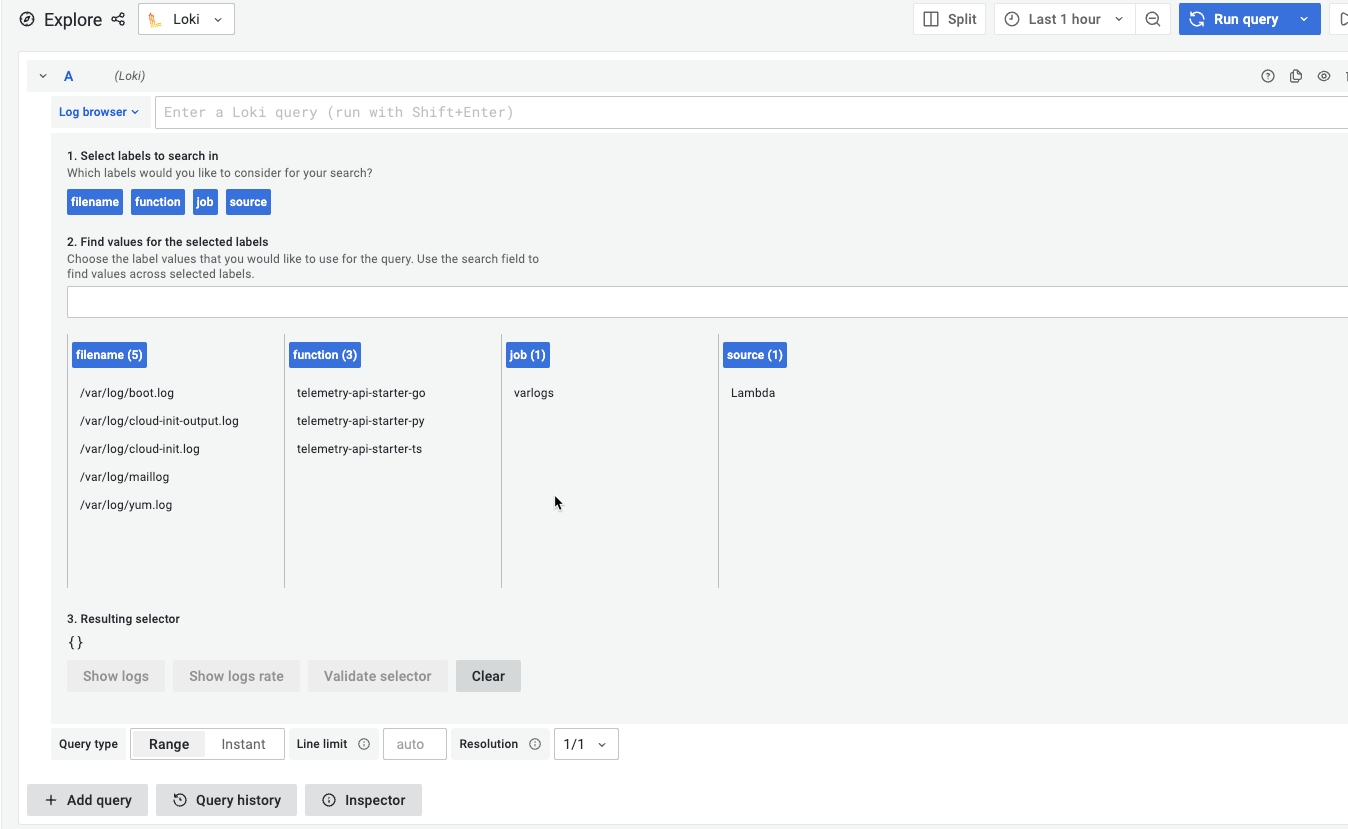
The Label source shows that we have Lambdaevents and the three different function tags let us query each of the Functions.
When you query these labels, you get only the Function logs, not the Platform or extension logs as in CLoudWatch:
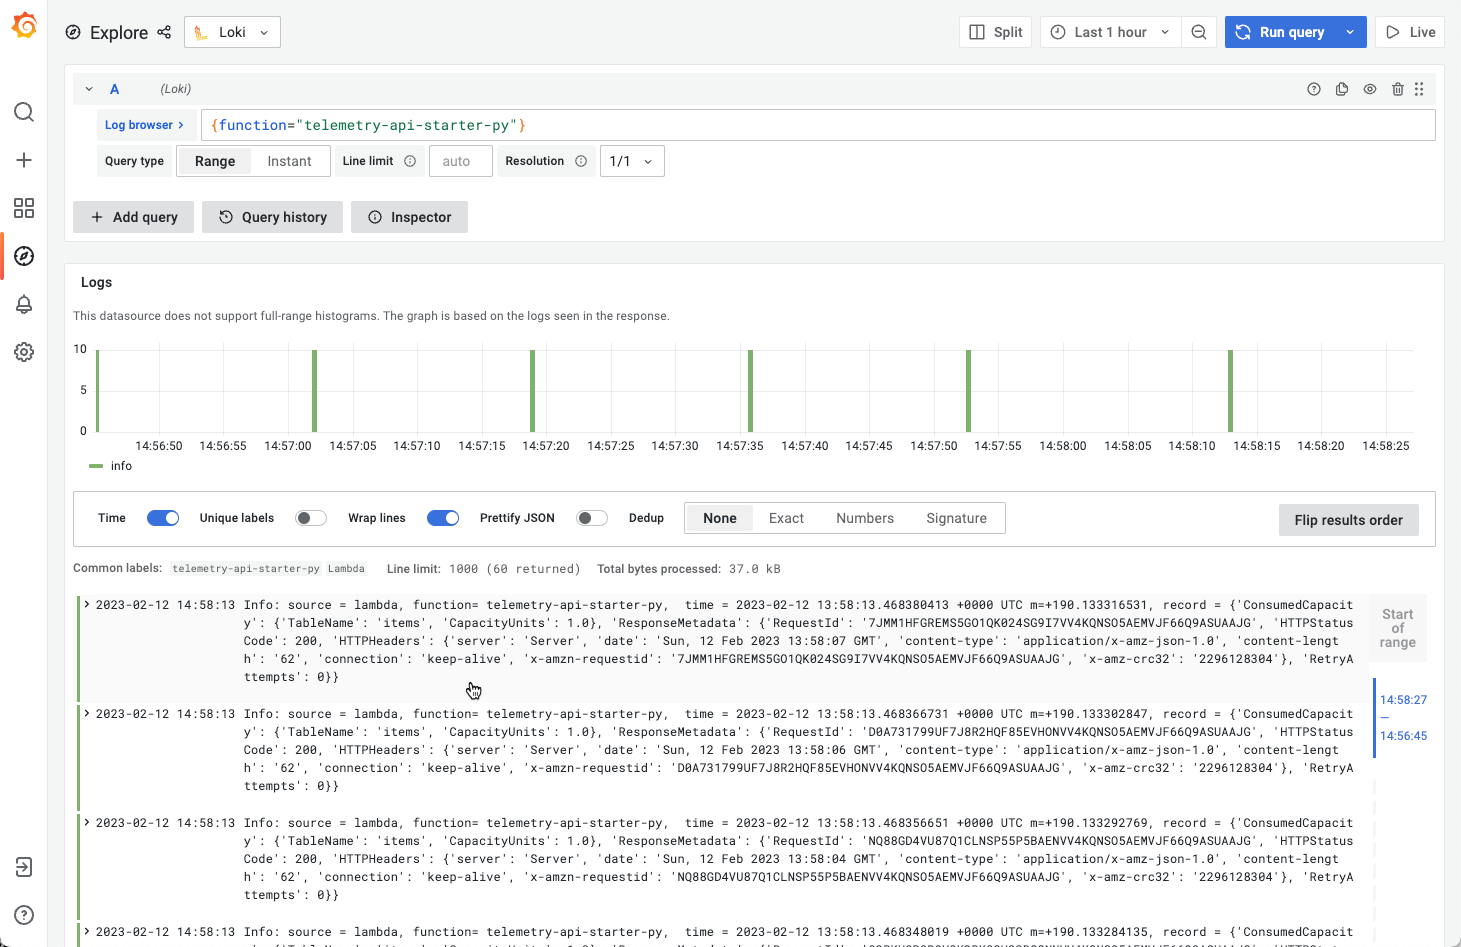
So the extension is working and all Function Logs are shipped to Loki!
Summary
The extension API and the telemetry extensions of Lambda open up possibilities for connecting telemetry data to AWS and non-AWS targets.
If the extension is up and running, you have much more flexibility than with CloudWatch alone. On the other hand, Lambda is highly integrated with CloudWatch logs, and you have to configure no additional Layers to get that.
So for the standard serverless App, the extensions should not be necessary. But for high volume or hybrid projects, it provides more functionality and saves costs because you do not need additional resources in the form of Log Functions.
The main advantage is that logging Lambda Functions do not use up the Lambda concurrency. Also, you can decide which Log events you want to see.
This article concludes the series about Serverless Observability.
If you need consulting for your serverless project, don’t hesitate to get in touch with the sponsor of this blog, tecRacer.
For more AWS development stuff, follow me on dev https://dev.to/megaproaktiv. Want to learn GO on AWS? GO here