Serverless Spy Vs. Spy Chapter 3: X-Ray vs Jaeger - Send Lambda traces with open telemetry
In modern architectures, Lambda functions co-exist with containers. Cloud Native Observability is achieved with open telemetry. I show you how to send open telemetry traces from Lambda to a Jaeger tracing server. Let’s see how this compares to the X-Ray tracing service.
Series
-
X-Ray: Getting started with X-Ray on Lambda with TypeScript/Python/Go
-
AWS Distro: AWS Distro for OpenTelemetry Lambda vs X-Ray SDK
-
Send Lambda traces with open telemetry: X-Ray vs Jaeger - Send Lambda traces with open telemetry
-
Telemetry API: Building an AWS Lambda Telemetry API extension for direct logging to Grafana Loki
As the Lambda setup with Typescript and Python already had a good coverage in chapter 2, I will stick to GO here. The CDK code is easy to migrate.
Setting
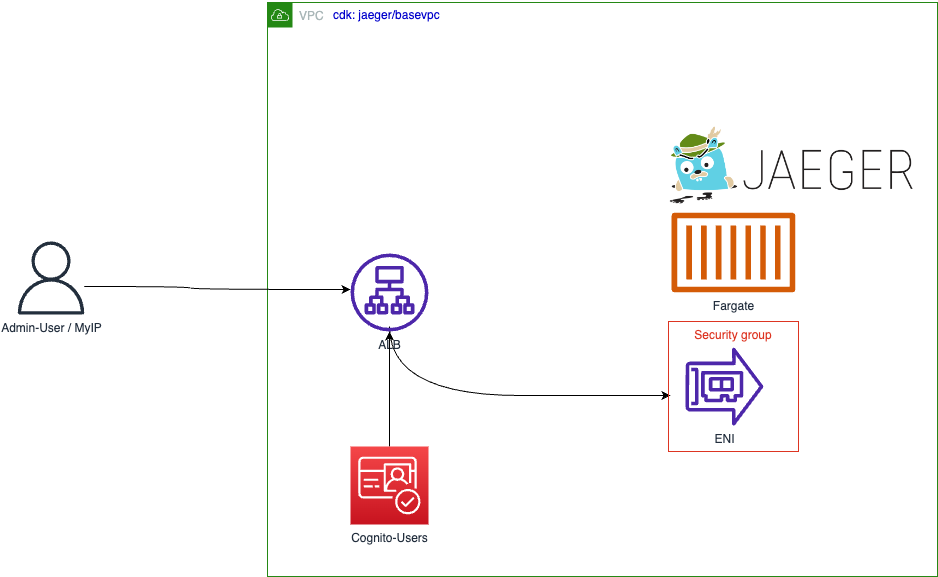
 Architecture overview
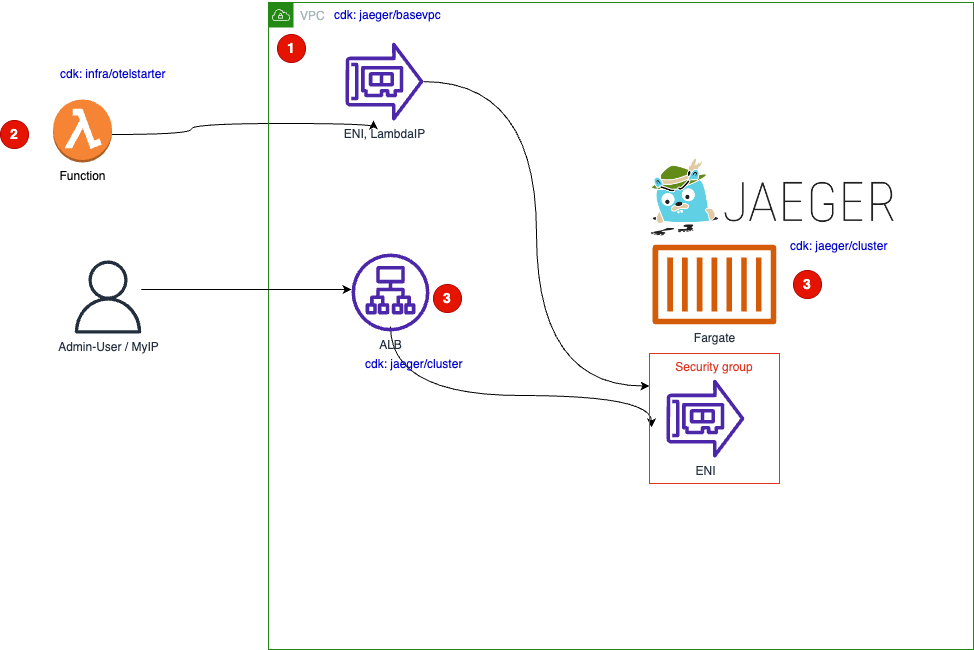
The Lambda Function (2) sends traces to the jaeger backend with the OpenTelemetry Protocol. Because we do not want to accept requests from the internet, Lambda has to run within the network of the VPC called basevpc. This VPC is created (1) at first. The jaeger container announces its IP via the AWS Serviced-Discovery service.
To access the frontend/UI of jaeger a Load Balancer is created between the internal jaeger service private IP and the internet.
The CDK code, the application code and jaeger itself are written on GO.
Lambda
Lambda Resources
 AWS Lambda Resources
  1   lambdaPath := filepath.Join(path, "../dist/main.zip")
  2   adotLayer := lambda.LayerVersion_FromLayerVersionArn(this, aws.String("adotlayer"),
  3     aws.String("arn:aws:lambda:eu-central-1:901920570463:layer:aws-otel-collector-amd64-ver-0-62-1:1"))
  4   fn := lambda.NewFunction(this, aws.String("adotlambda"),
  5   &lambda.FunctionProps{
  6     Vpc: vpc,
  7     Handler: aws.String("main"),
  8     Runtime: lambda.Runtime_PROVIDED_AL2(),
  9     Tracing: lambda.Tracing_ACTIVE,
 10     Environment: &map[string]*string{
 11       "OPENTELEMETRY_COLLECTOR_CONFIG_FILE" : aws.String("/var/task/config.yml"),
 12       // "https://opentelemetry.io/docs/concepts/sdk-configuration/general-sdk-configuration/"
 13       "OTEL_SERVICE_NAME" : aws.String("documentcounter"),
 14     },
 15     AllowPublicSubnet: aws.Bool(true),
 16     Layers: &[]lambda.ILayerVersion{
 17         adotLayer,
 18     },
 19     },
 20   )
You have to define the following configuration, see Chapter 2:
- Line 2:3 - The Lambda Layer for the otel collector
- Line 6 - run in the VPC
- Line 1 - Set the configuration file location
- Line 16 - Activate the layer
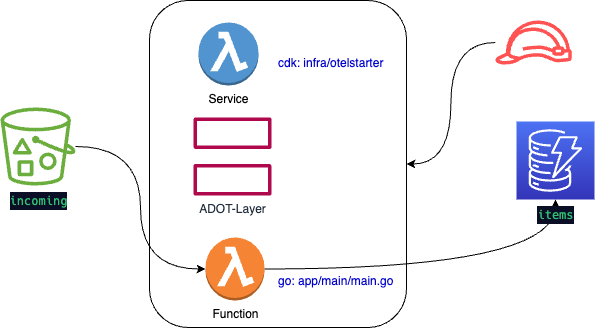
Lambda Code
In the application you have to do:
1. Configure the middleware to send traces
otelaws.AppendMiddlewares(&cfg.APIOptions)
ClientDDB = dynamodb.NewFromConfig(cfg)
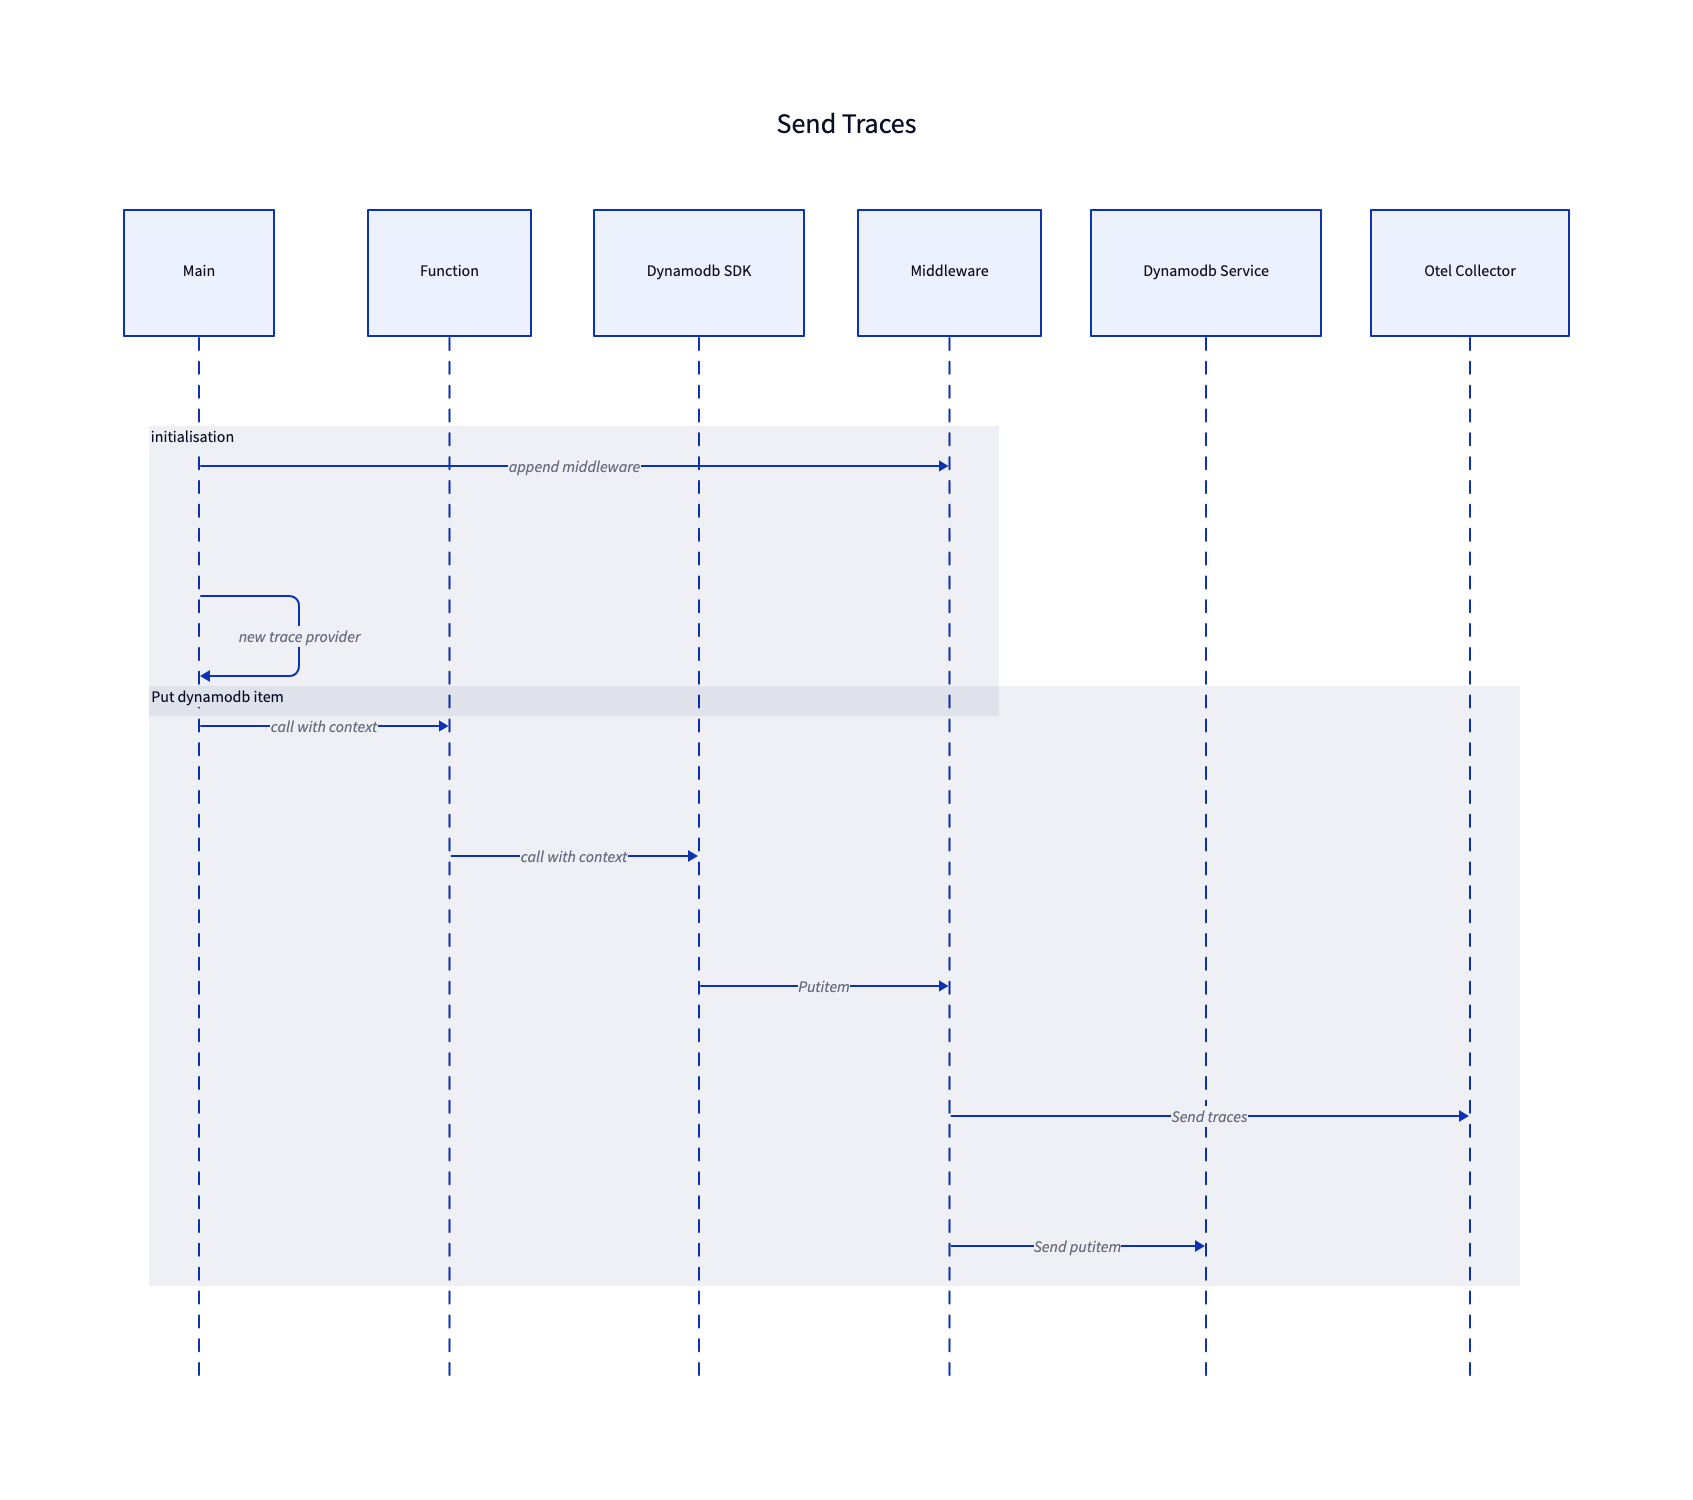
2. Propagate the context through all functions:
- From main:
tp, err := xrayconfig.NewTracerProvider(ctx)
//...
lambda.Start(otellambda.InstrumentHandler(HandleRequest, xrayconfig.WithRecommendedOptions(tp)... ))
- to HandleRequest
func HandleRequest(ctx context.Context, s3Event events.S3Event) (string, error) {
//...
putItem(ctx,s3input)
- to putitem
func putItem(ctx context.Context, itemID string){
//...
result, err := ClientDDB.PutItem(ctx,input)
In the app, at the end an s3 listobjects is performed, so that you have two AWS services in the traces.
See Chapter 2 for more details.
Now Lambda could send traces, so we need a target. I chose Jaeger, an open-source, end-to-end distributed tracing, originally provided by Uber Technologies.
Jaeger Installation
VPC
We provide a VPN to run the ECS service - just a VPC with a private subnet.
Fargate Service
 The JAEGER service
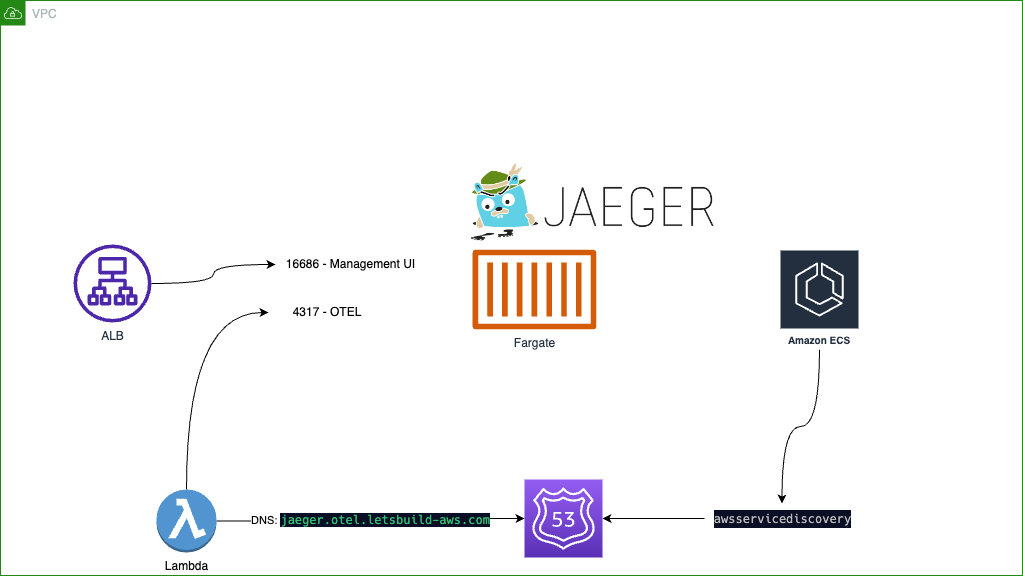
The front end will be provided on port 16686, the OTEL request will go to port 4317 via gRPC. All jaeger ports are described in the deployment part of the jaeger documentation.
To access the jager front end with a DNS name, you have to have a domain. So change the following configurations in jaeger/cluster.go:
var SERVICE_NAME = "jaeger"
var NAMESPACE = "otel.letsbuild-aws.com"
var HOSTED_ZONE_ID = "Z042038724KH99T9LFKK6"
var DNS_NAME = "service.letsbuild-aws.com"
In this example, I have created a subdomain “service.letsbuild-aws.com” for the Load Balancer. The NAMESPACE is used for service discovery. You do not need a real domain for service discovery.
To get jaeger up and running, there is an all-in-one image we use:
jaegertracing/all-in-one:1.39.0
The jaeger container can be configured via the environment:
"SPAN_STORAGE_TYPE":      aws.String("memory"),
"COLLECTOR_OTLP_ENABLED": aws.String("true"),
"LOG_LEVEL":              aws.String("debug"),
To keep it (almost) simple, the storage is set to memory. In production, you could use Cassandra, elasticsearch and other backends. As stated in the jaeger documentation, all CLI parameters can be set via ENV variables. To be able to receive otlp data, its enabled.
The management ui and otlp ports are configured for the container:
task.AddContainer(aws.String("jaegerContainer"),
    &ecs.ContainerDefinitionOptions{
        Image:         ecs.ContainerImage_FromRegistry(aws.String("jaegertracing/all-in-one:1.39.0"), nil),
        ContainerName: aws.String("jaeger-all"),
//...
        PortMappings: &[]*ecs.PortMapping{
            {
                ContainerPort: MANAGEMENT_PORT,
                HostPort:      MANAGEMENT_PORT,
                Protocol:      ecs.Protocol_TCP,
                // management
            },
            {
                ContainerPort: aws.Float64(4317),
                HostPort:      aws.Float64(4317),
                Protocol:      ecs.Protocol_TCP,
                // "otel-grpc"
            },
//...
See the jaeger/cluster.go file for the complete source.
Connect Lambda to Jaeger
On the jaeger side a namespace is configured:
namespace := awsservicediscovery.NewPrivateDnsNamespace(this, aws.String("oteltrace-namespace"),
    &awsservicediscovery.PrivateDnsNamespaceProps{
        Name:        aws.String(NAMESPACE),
        Description: aws.String("DNS service discovery subdomain"),
        Vpc:         vpc,
    },
)
This creates an entry in the private domain otel.letsbuild-aws.com:
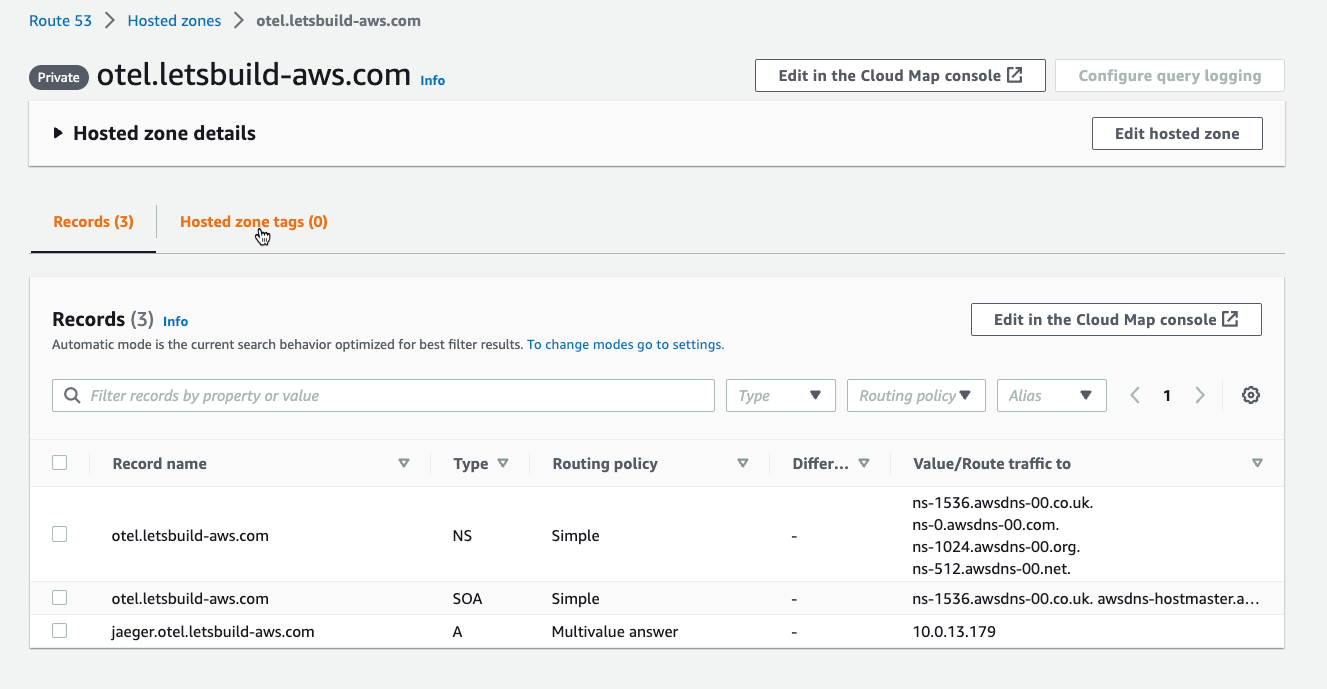
On the Lambda side the first thing is to tell the adot Layer, where to find the config file:
"OPENTELEMETRY_COLLECTOR_CONFIG_FILE" : aws.String("/var/task/config.yml"),
Because Lambda apps are deployed into the directory /var/task on the Lambda micro-vm, you have to prepend the path /var/task.
You find the file here: app/config.yml
The configuration is added to the Lambda deployment package:
env GOOS=linux GOARCH=amd64 CGO_ENABLED=0 go build -ldflags="-s -w" -o ../dist/main main/main.go
chmod +x ../dist/main
mv ../dist/main ../dist/bootstrap
cp config.yml ../dist
cd ../dist && zip main.zip bootstrap config.yml
The lambda package build script
Configuration
In the configuration, we have three parts
- The local receiver:
receivers:
  otlp:
    protocols:
      grpc:
        endpoint: 0.0.0.0:4317
It receives the traces.
- The exporter
exporters:
  otlp:
    endpoint: jaeger.otel.letsbuild-aws.com:4317
    tls:
      insecure: true
Here the dns name from the awsservicediscovery is used for the ENDPOINT.
- The pipelines
Now incoming receiver is piped to the outgoing exporter
service:
  pipelines:
    traces:
      receivers: [otlp]
      exporters: [ otlp]
Details are described in the OpenTelemetry documentation. As stated in chapter 2, not all configurations are valid here.
Compare X-Ray UI to Jager UI
X-Ray now
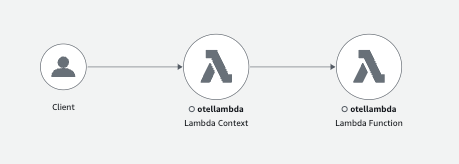
As the collector is not configured for X-Ray traces, we just see the data from the Lambda service, not the function:
Switch the configuration back to x-rays:
- Change app/config.yml
Samples for the configurations are provided in
app/config-otel.ymlapp/config-xray.yml
- Deploy app
cd app
task fastdeploy
Then some traffic:
cd ..
task traffic
Then we see all nodes in the X-Ray Map view:
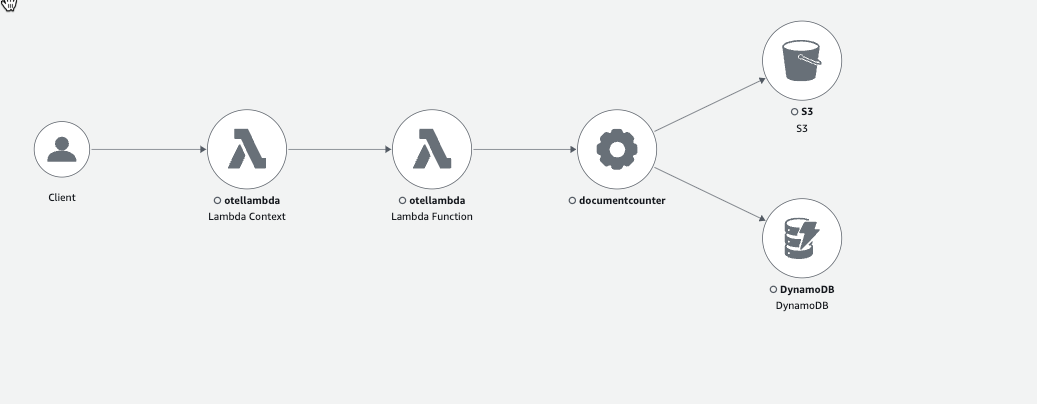
And some traces.
 X-Ray Trace Map
Jaeger/Otel
Switch the configuration back to otel and deploy Lambda app again. After creating some traffic, you see traces in the jaeger ui.
Access the jaeger UI from the loadbalancer dns entry or your domain name.
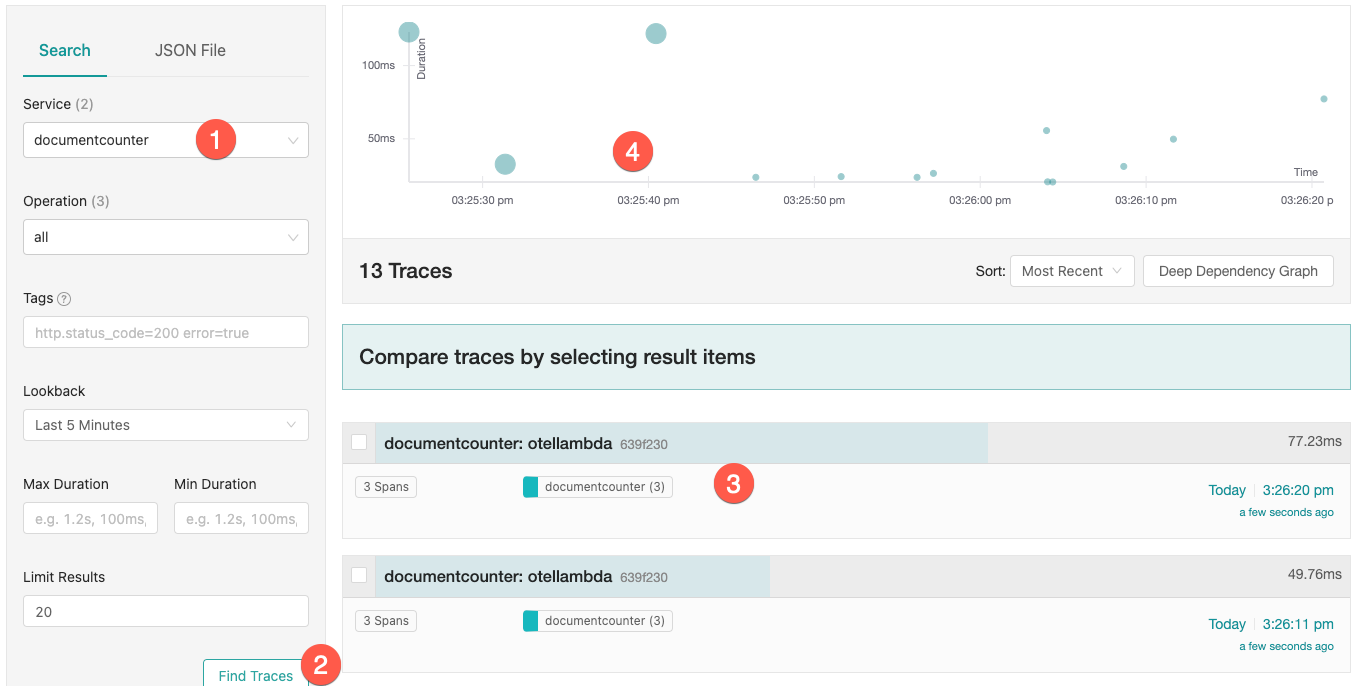 Jaeger Trace Map
- Choose Service documentcounter here
This is the name I set with the environment variable
OTEL_SERVICE_NAME, configured in the Lambda Resource. - The button [Find Traces] shows a graphical view (4) and the single traces
Click on a trace (3) to see the detail view:
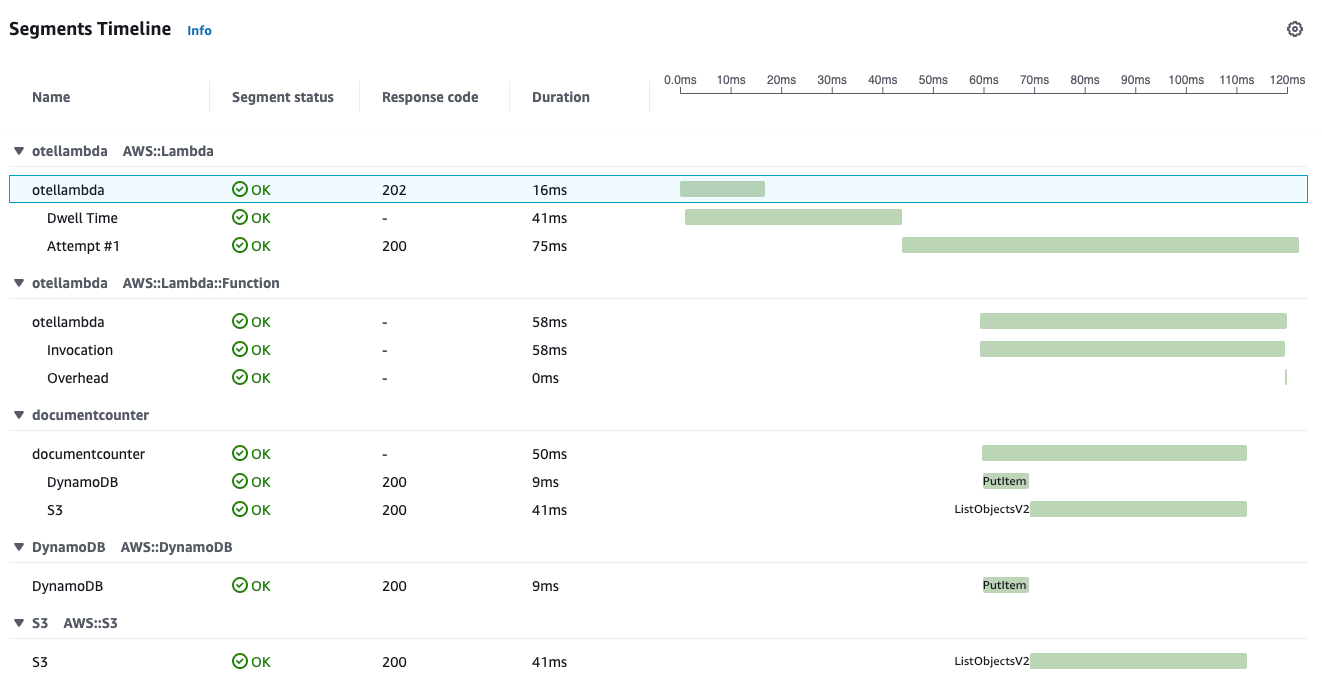
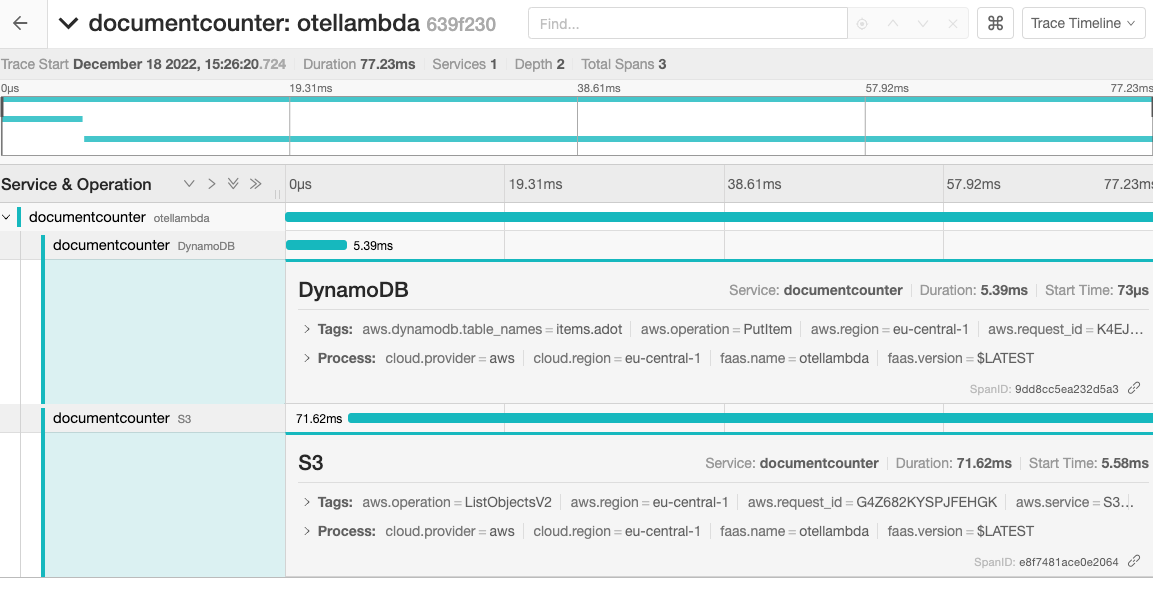 Jaeger Timeline
Comparing both trace maps we notice the missing nodes with the AWS service icons.
Comparing the timelines, you see that the segments otellambda AWS::Lambda and otellamba AWS::Lambda::Function only appear in X-Ray, not on jaeger.
That is because only the Lambda Function sends traces, not the Lambda Service. In the “Cloud-Native” container world, usually, it is assumed that the container is already running. So the startup time is not interesting. In Lambda the micro-vm is started, when a request hits a cold start. If that happens often, it may affect your overall latency, so you want to have data. You may get the init duration also from the Lambda Logs. If you need information from the Lambda Resource, you might use the Lambda extensions and the AWS Lambda Telemetry API, which I will cover in the last chapter.
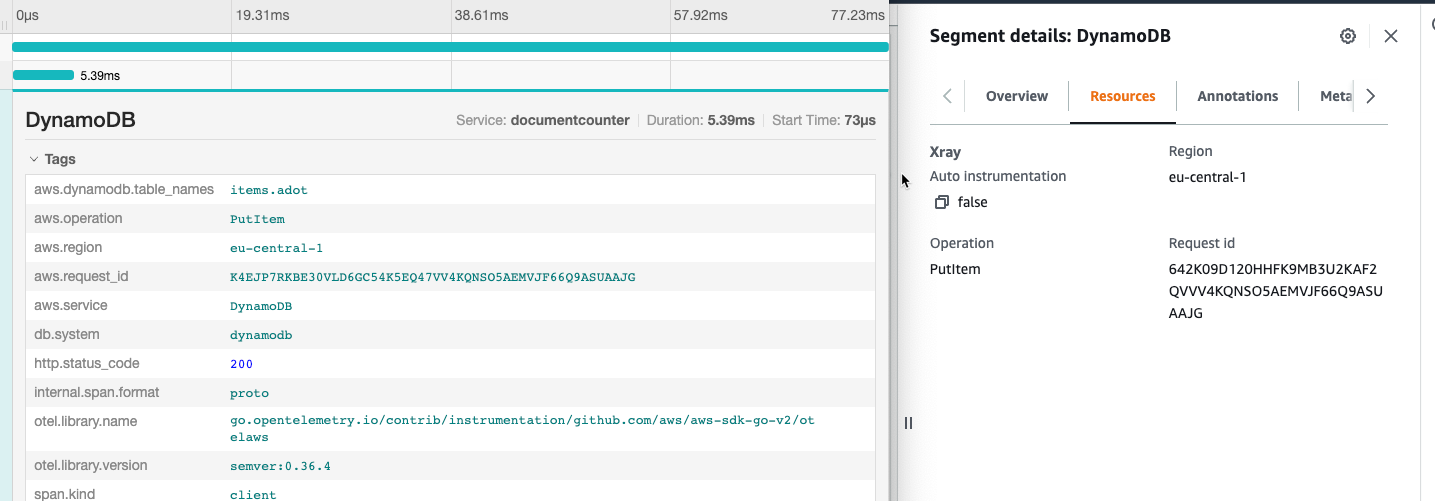
The detail information are almost the same:
Is there a winner?
Functionality
If you have to decide whether to use X-Ray or other services for your traces, ADOT is the more flexible choice. It provides more support from various sources.
For services that have a large AWS part, the X-Ray service provide some more functionality like creating nodes.
Cost
It depends on your metrics!
Otel open source tracing e.g. jaeger
I have seen some other posts, which stated that an extra tracing service would be cheaper, “because it is open source”. If you compare the costs the tco have some more parts:
- Costs of the running container
Price in eu-central-1 per vCPU per hour $0.04656 per GB per hour $0.00511 With 2 vCPU | 4 GB
Which would be 62.01 €/month
- Cost of storage: depends on backend
In the production environment, you would like to set up an application load balancer with cognito authentication with additional costs.
X-Ray
The X-Ray server costs are $5.00 per 1 million traces in eu-central-1. You can also adapt the sample rate to not have a trace with each call.
Operations
The telemetry infrastructure setup is done only once. Once you have it running, there should be not much to do.
With X-Ray, there is no additional operational cost.
Usage
Because you provide the jaeger container yourself, you can adapt the size to the speed you need. In my tests the jaeger frontend seemed very much faster than the X-Ray aka CloudWatch Service Map.
Conclusion
With the sample apps from the opentelemetry-lambda repository the Lambda part itself was easy to implement. What took me some time was to provide the jaeger Fargate service with IaC ouside of an k8s environment. But with ECS and ServiceDiscovery that was easy in the end. This should be even more simple in an EKS environment with the jaegertracing helm-charts.
Using something else as tracing solution instead of X-Ray not looks like a good choice for AWS serverless projects. But if you have a container solution up and running, otel would be a good choice for an environment, where container traces and Lambda traces are stored together.
See also
If you need consulting for your serverless project, don’t hesitate to get in touch with the sponsor of this blog, tecRacer.
For more AWS development stuff, follow me on dev https://dev.to/megaproaktiv.
Appendix: Quick Walkthrough
- Clone repository
git clone https://github.com/megaproaktiv/adot-otelstarter.git
cd adot-otelstarter
- Set region export AWS_REGION=yourregion, e.g.
export AWS_REGION=eu-central-1
- If CDK is not bootstrapped:
task bootstrap
- Create VPC
task jaeger:deploy-vpc
- Set Domain and Service configuration
Edit jaeger/cluster.go:
  var SERVICE_NAME = "jaeger"
  var NAMESPACE = "otel.letsbuild-aws.com"
  var HOSTED_ZONE_ID = "Z042035555KH99T9LFKK6"
  var DNS_NAME = "service.letsbuild-aws.com"
- Create ECS cluster with jaeger service
task jaeger:deploy-jaeger
- Deploy Lambda Resources and function
task deploy
Note: because of the ENI this could take a few minutes
- Create Traffic
task traffic