Serverless Spy Vs Spy Chapter 1: X-ray
There are several ways to perform espionage activities in the life of a serverless app, which all battle for your attention. Time for the advent of counterintelligence: We want answers! - And CDK/Source examples of how to use it! Here we go, Serverless spy vs spy in four chapters, each post published after you light the next candle.
Series
-
X-Ray: Getting started with X-Ray on Lambda with TypeScript/Python/Go
-
AWS Distro: AWS Distro for OpenTelemetry Lambda vs X-Ray SDK
-
Send Lambda traces with open telemetry: X-Ray vs Jaeger - Send Lambda traces with open telemetry
-
Telemetry API: Building an AWS Lambda Telemetry API extension for direct logging to Grafana Loki
Serverless observability concepts
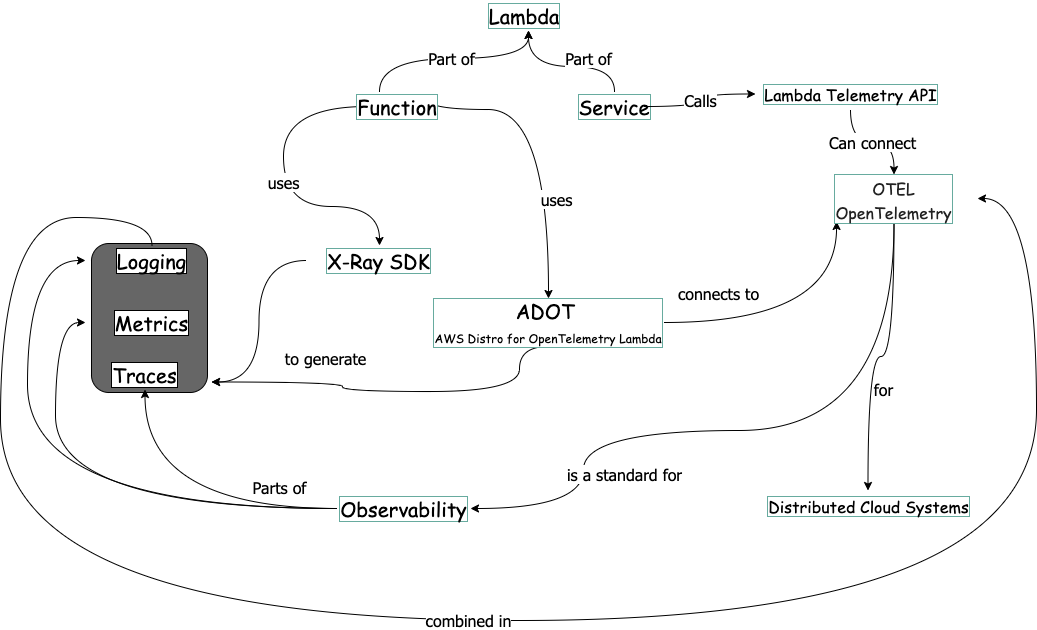
This concept map shows the observability domain. With practical examples, I will explore the concepts one by one. Starting with X-Ray.
The X-Ray Service and the X-Ray SDK
In serverless development, we have the problem of the “missing cloud profiler”. We cannot look into the distributed Lambda Function/services to see where performance bottlenecks are.
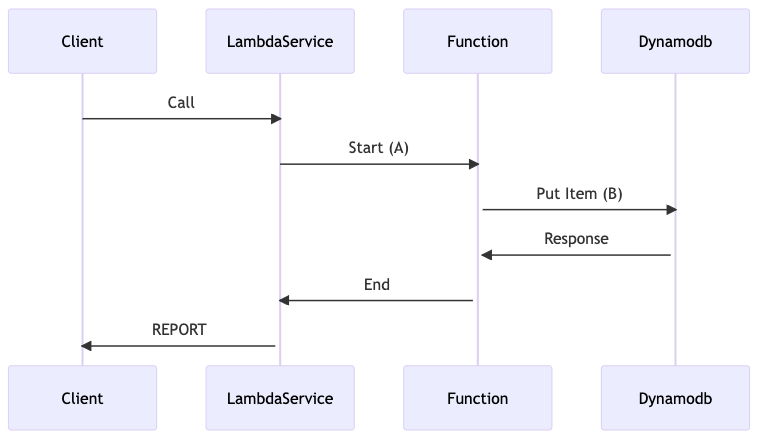
Let`s assume we have a Function which is calling another Service:
We test the function (1) and get results, how long it takes:
REPORT RequestId: c7e872b4-1fd4-492b-81f9-8cf22d67827b Duration: 83.23 ms Billed Duration: 84 ms Memory Size: 1024 MB Max Memory Used: 47 MB Init Duration: 172.27 ms
We know about warm/cold start and call again:
REPORT RequestId: 99b658c0-d946-4f17-bed1-890668051b74 Duration: 9.31 ms Billed Duration: 10 ms Memory Size: 1024 MB Max Memory Used: 47 MB
The part-whole problem
What we do not know is how much time was spent in segment A and how much is spent in segment B. We only know A+B.
So this is your espionage order!
The distribution problem
We could do some logging. But another problem comes into mind: The duration of each lambda call is statistically distributed. That means the value for a single call could be way off. So we have to look at a bunch of calls.
The every-single-service problem
Now assume we are working with several AWS service calls. With logging, we had to log before and after each call.
After solving all the problems, we have to create some software for analysis.
To solve this with logging alone, you need correlation IDs in each log and have to search all logs events.
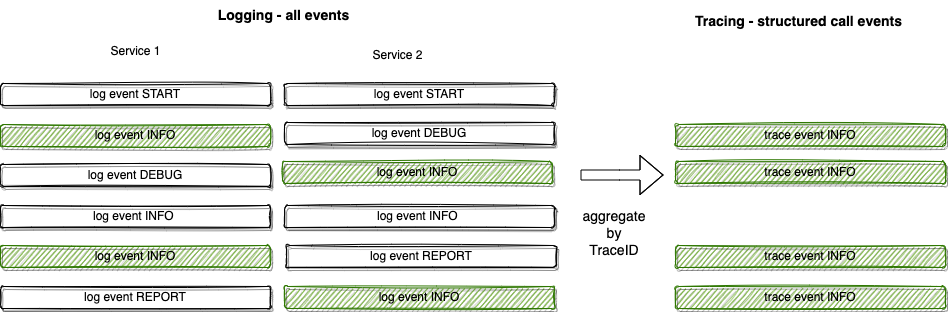
The correlation ID is called TraceID. And tracing gets all information about a request aggregated by request. In doing this, you can trace the call of a single session through all services.
X-Ray is the tracing solution on AWS.
How X-Ray works
The part-whole solution
In X-Ray, we have segments and sub-segments. We see A, B and A+B segments.
The distribution solution
All services must send data about their communication to a central tracing service so we also have an overview of what is happening.
The every-single-service problem
With the AWS SDK, the X-Ray SDK hooks itself into all AWS service calls. So we do not have to decorate each call, it is done automatically for you.
Getting started
We use a modified simple lambda application from tecRacer serverless sample application. Get the modified source for this post from github: xraystarter and leave a star :)
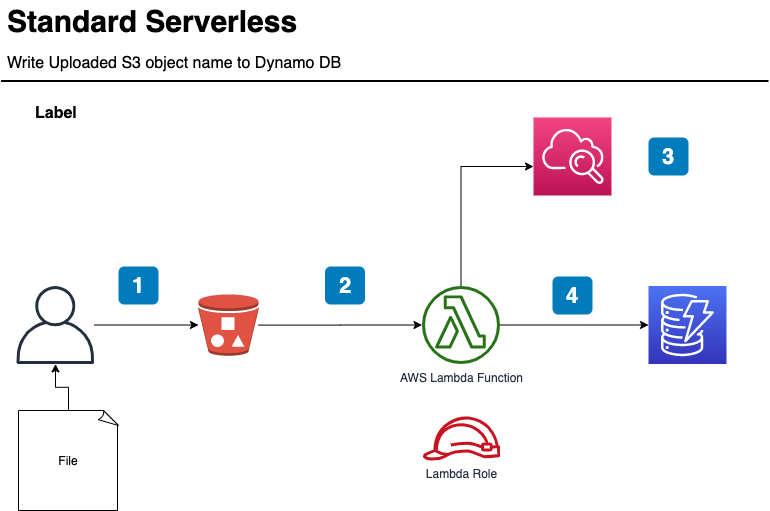
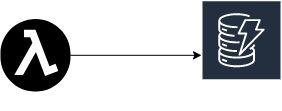
The simple architecture of the base serverless application.
- The client uploads a file to an S3 bucket
- The Lambda function gets an event
- The Lambda service and the Lambda function write logs
- The Lambda function writes the key of the file to dynamodb
As the examples are for three Lambda functions: TypeScript, Python and GO, we change the architecture a bit:
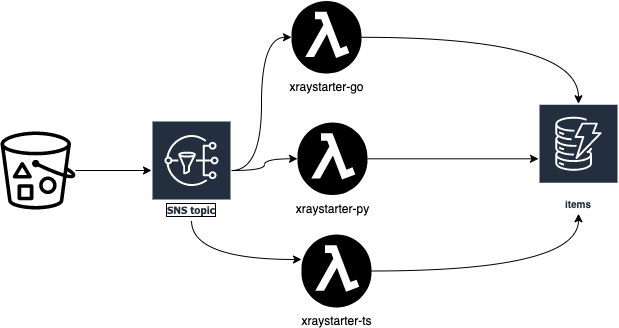
I will walk you through deploying the application to see some X-Ray traces.
Prerequisite:
You have to have the tools installed. With these tools on a mac, the steps are automated.
AWS CDK
This is the Infrastructure as Code tool.
Task
This is the better makefile to allow you to deploy the example.
Colima
We need a Docker daemon, as the Python and the TypeScript Lambda functions need more tools installed to be built. This is simplified with Docker, and the use of the CDK Constructs NodejsFunction and PythonFunction. The GO Lambda just needs GO to be build.
If you want to change it to a standard CDK Lambda Function, you can do a task fastdeploy in the Lambda directories to update just the Lambda Function code:
lambda
├── go
│   ├── Taskfile.yml
│   ├── dist
│   ├── go.mod
│   ├── go.sum
│   └── main
├── py
│   ├── Taskfile.yml
│   ├── __init__.py
│   ├── app.py
│   ├── dist
│   ├── package
│   └── requirements.txt
└── ts
    ├── Taskfile.yml
    ├── dist
    ├── index.ts
    ├── node_modules
    ├── package-lock.json
    ├── package.json
    ├── test
    └── tsconfig.json
Start Docker
Because of the Docker Desktop policies I replace Docker Desktop with Colima.
Do:
task colima
The Output is like:
task: [colima] colima start
INFO[0000] starting colima
...
INFO[0022] starting ...                                  context=docker
INFO[0027] done
Boostrap Account for cdk
If you use AWS CDK for the first time
Do:
task bootstrap
Output like:
task: [bootstrap] npx cdk@2.51.1  bootstrap
Sending build context to Docker daemon  54.27kB
Step 1/12 : ARG IMAGE=public.ecr.aws/sam/build-nodejs14.x
...
 ⏳  Bootstrapping environment aws://123456789012/eu-central-1...
...
 ✅  Environment aws://123456789012/eu-central-1 bootstrapped.
Deploy application
Do:
task deploy
Output like:
Step 1/12 : ARG IMAGE=public.ecr.aws/sam/build-nodejs14.x

 ✅  xraystarter

✨  Deployment time: 105.63s

Outputs:
xraystarter.BucketName = xraystarter-incoming0b397865-1hx8j3qf51d0x
xraystarter.LambdaNameGo = xraystarter-go
xraystarter.LambdaNamePy = xraystarter-py
xraystarter.LambdaNameTS = xraystarter-ts
xraystarter.TableName = items
Stack ARN:
arn:aws:cloudformation:eu-central-1:139008737997:stack/xraystarter/c289f610-6e4a-11ed-a2f1-02f07fd68fb2

✨  Total time: 110.91s
Now we are ready to use the application.
Generate Traffic
Do:
./test/traffic.sh
This puts files on the S3 bucket, and the Lambda Functions are triggered. Stop after 2 cycles.
A Look at X-Ray
X-Ray Service Map
The first thing I look at is the Service Map. You get there in the AWS Console choosing Cloudwatch -> X-Ray traces -> Service Map:
The map for all three lambdas first looked like this:
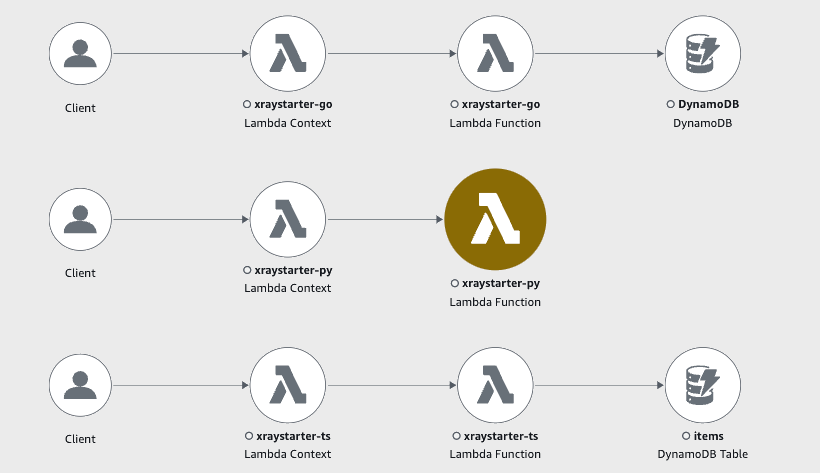
Spy on an error: A Python Problem
Espionage
We see at first glance that the python Function xraystarter-py has a Problem! Now we can use the traces and the logs to find the cause of the problem.
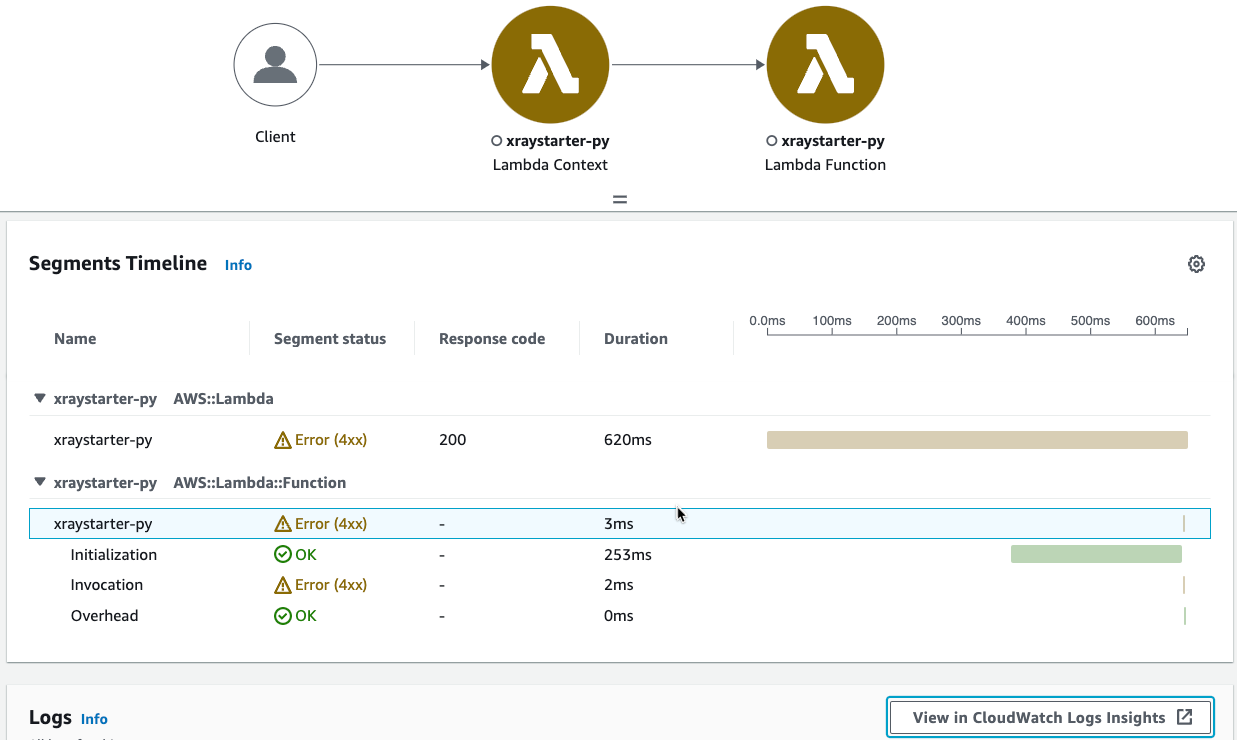
You see that the invocation itself got an error. A click leads us to “View in CloudWatch Logs insights”
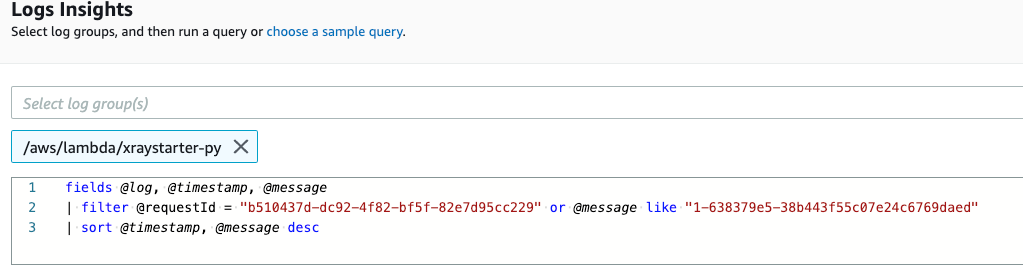
With problems inside the application, you get all log events here. But because this is an problem before the function is executed, the error is published by the Lambda service and does not have an ID in the log event. Therefore we find the whole log stream itself.
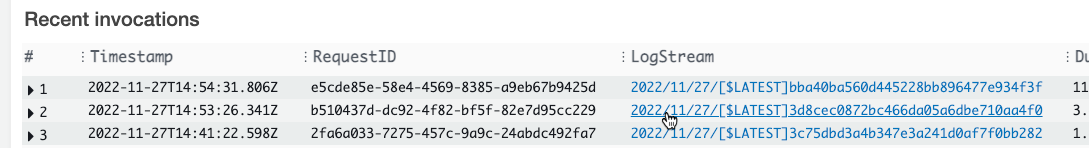
With the requestId b510437d-... you find the log stream in Lambda recent invocations:
In the log itself you find:
[ERROR] Runtime.ImportModuleError: Unable to import module 'app': No module named 'aws_xray_sdk'
Traceback (most recent call last):
Looks like the CDK construct from aws-lambda-python-alpha did not include the X-Ray library.
Well, its alpha, so OK:
import { PythonFunction } from '@aws-cdk/aws-lambda-python-alpha';
Solution
In the directory of the Python Lambda function we have a task fastdeploy, which updates just the function code, but with all libraries:
cd lambda/py
task fastdeploy
What it does:
- Create a complete zip with the X-Ray sdk
      - pip install --target ./package -r requirements.txt
      - cd package && zip -r ../my-deployment-package.zip .
      - zip my-deployment-package.zip app.py
      - mv my-deployment-package.zip dist/app.zip
- Update the function code
    vars:
      FN:
        sh: aws cloudformation list-exports --query "Exports[?Name == 'xraystarter-py-name'].Value" --output text
    cmds:
      - aws lambda update-function-code --function-name  {{.FN}} --zip-file fileb://dist/app.zip
The name of the Lambda Function is exported, so we get it with cloudformation list-exports.
See the lambda/py/Taskfile.yml for the code.
Run again
We wait 15 mins, so that the old data is not shown (if we filter on that time range). Then again create traffic:
Do:
./test/traffic.sh
Output:
So 27 Nov 2022 18:53:58 CET
upload: ./readme.md to s3://xraystarter-incoming0b397865-1hx8j3qf51d0x//test-20-0-0-0
So 27 Nov 2022 18:54:09 CET
upload: ./readme.md to s3://xraystarter-incoming0b397865-1hx8j3qf51d0x//test-20-0-0-1
Cleared Service Map
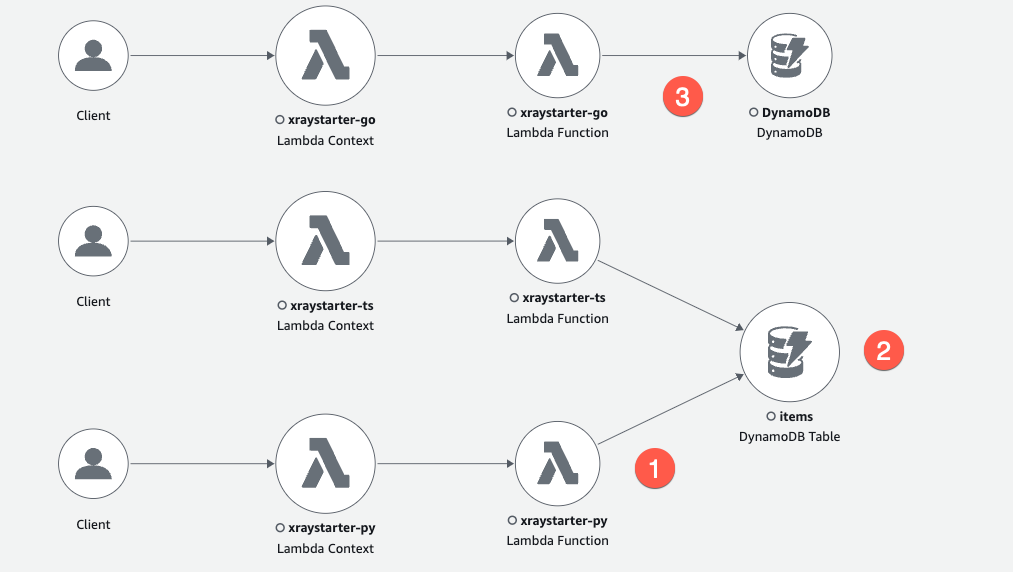
The (1) xraystarter-py has zero errors and writes to the items table (2). Node and Python SDK propagate the table name to X-Ray, and the GO X-Ray SDK behaves differently (3). But all Lambda Functions write to the same table.
How to instrument X-Ray on Lambda
The XRay SDKs contains all function to send tracing information from the Lambda Function to the X-Ray server. Witch activated X-Ray, the Lambda Service sends information too.
Step 1) Create Lambda Services with Y-Ray support
See lib/xraystarter-stack.ts for details.
Typescript
const fnTS = new NodejsFunction(this, "xraystarter-ts", {
  //...
  tracing: aws_lambda.Tracing.ACTIVE,
  //...
})
Python
const fnPy = new PythonFunction(this, 'xraystarter-py', {
//...
  tracing: aws_lambda.Tracing.ACTIVE,
//...
});
Go
const fnGO = new aws_lambda.Function(this, 'xraystarter-go', {
  //...
  tracing: aws_lambda.Tracing.ACTIVE,
  //...
});
Step 2) Load the X-Ray SDK
Typescript
import * as AWSXRay from 'aws-xray-sdk'
Python
from aws_xray_sdk.core import xray_recorder
from aws_xray_sdk.core import patch_all
Go
import (
	"github.com/aws/aws-xray-sdk-go/instrumentation/awsv2"
	"github.com/aws/aws-xray-sdk-go/xray"

)
Step 3) bind aws calls to xray
Typescript
In Ts you create a constant which replaces the normal creation of a client:
import * as AWS from 'aws-sdk';
//...
const dynamodb = new AWS.DynamoDB();
Patch AWS variable with:
const AWS = AWSXRay.captureAWS(require('aws-sdk'));
You see in the node xrays sdk that each AWS service is customized with the captureAWSRequest function, which is responsible for the X-Ray calls.
  for (var prop in awssdk) {
    if (awssdk[prop].serviceIdentifier) {
      var Service = awssdk[prop];
      Service.prototype.customizeRequests(captureAWSRequest);
    }
Python
In python you just call a function to do the patching.
patch_all()
The nested magic is happening in the patcher.py function of the SDK.
A def _patch_func(parent, func_name, func, modifier=lambda x: x):
calls a setattr:
setattr(parent, func_name, modifier(xray_recorder.capture(name=capture_name)(func)))
Go
In GO, you intercept the middleware.
In GO SDK V2, you can change the client request pipeline directly. This way, you can add behaviour before or after each step of an AWS api call.
	cfg, err := config.LoadDefaultConfig(context.TODO())
	if err != nil {
		panic("unable to load SDK config, " + err.Error())
	}
	// Using the Config value, create the DynamoDB client
	awsv2.AWSV2Instrumentor(&cfg.APIOptions)
	Client = dynamodb.NewFromConfig(cfg)
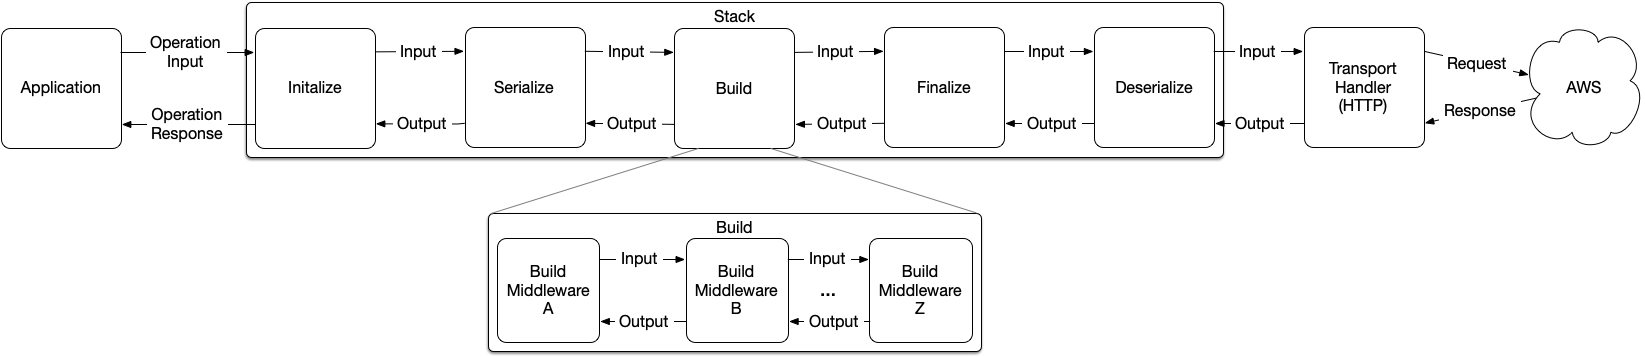
When you look at the GO X-Ray SDK you can see in func initializeMiddlewareAfter(stack *middleware.Stack) how the calls to X-Ray are generated. The call to X-Ray happens in the deserialize step.
Back to espionage order: Query traces
Query Traces of a single service
In CloudWatch > Traces we now run a query for each service:
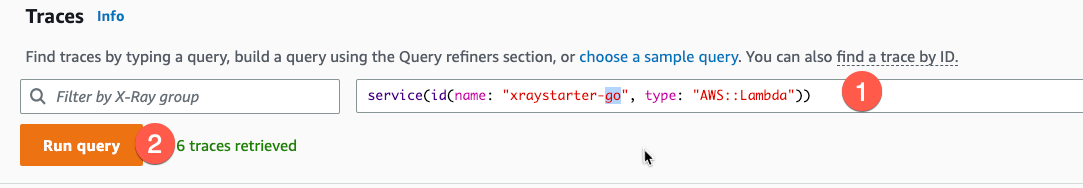
- Set filter
- Run query
TypeScript
Query: service(id(name: "xraystarter-ts", type: "AWS::Lambda"))
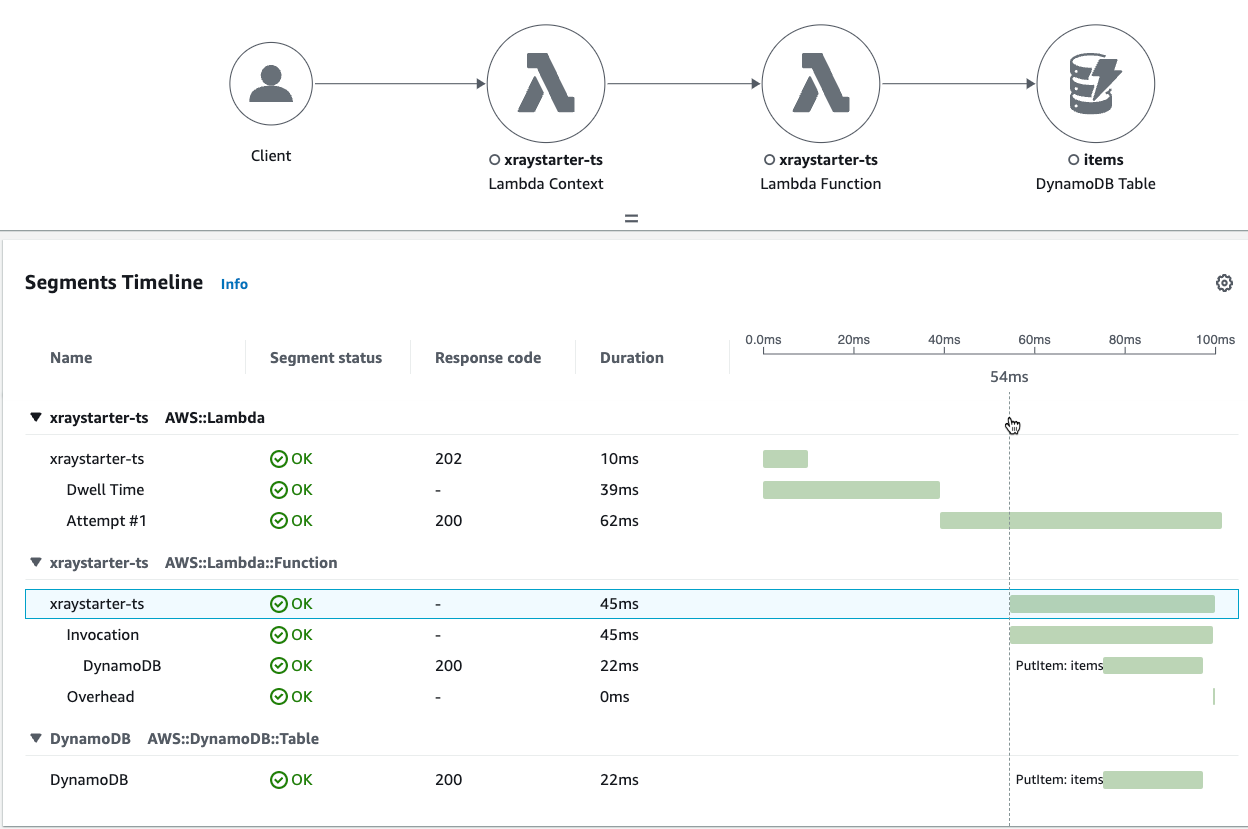
Segments Timeline
Python
Query: service(id(name: "xraystarter-py", type: "AWS::Lambda"))
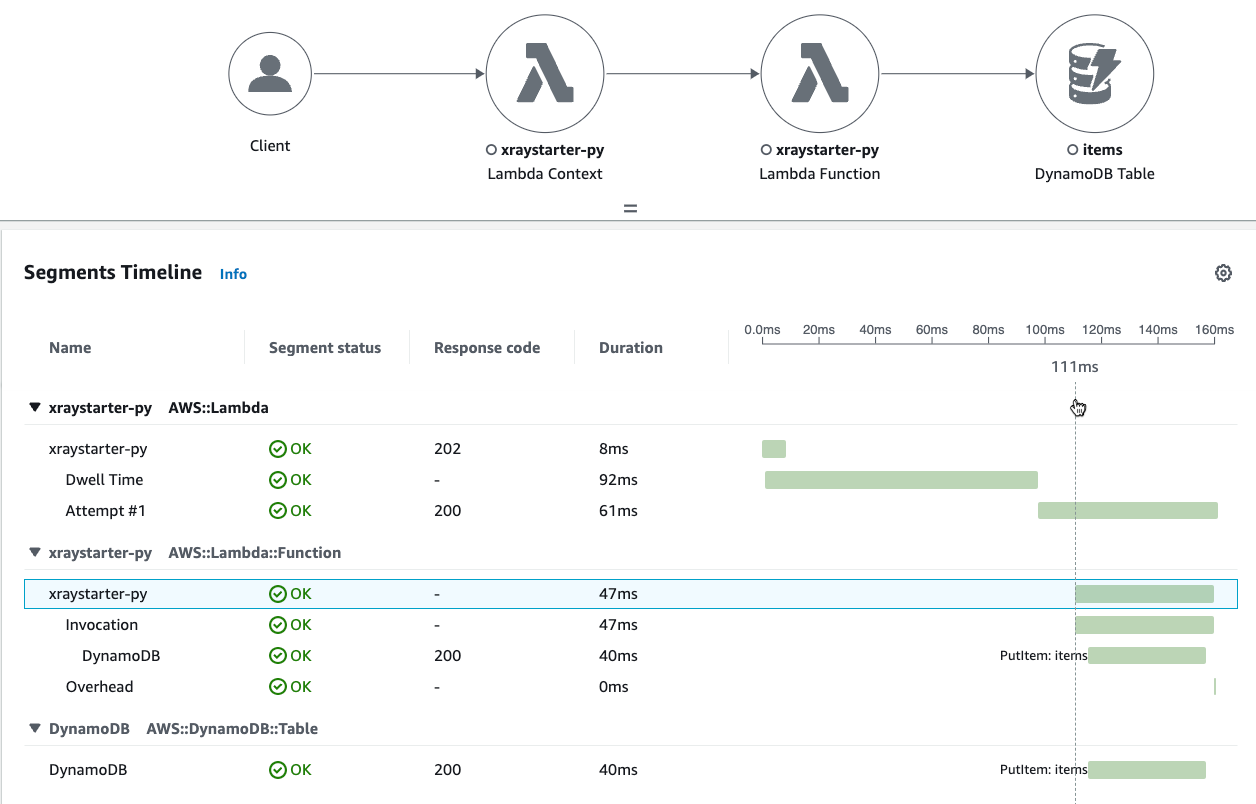
Segments Timeline
GO
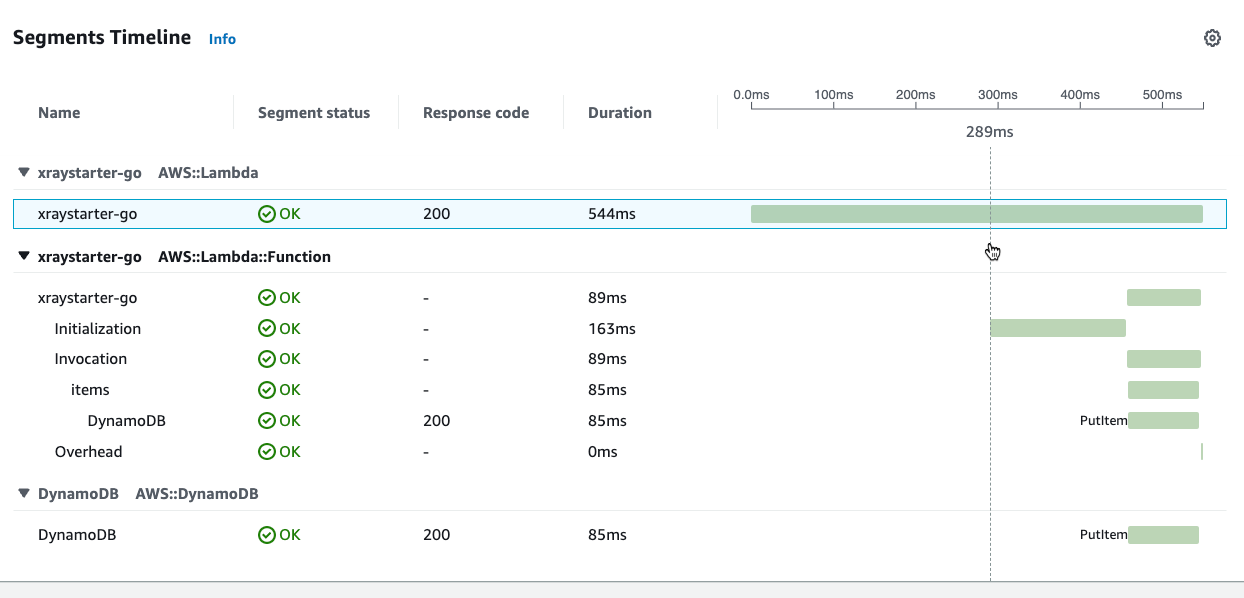
Query: service(id(name: "xraystarter-go", type: "AWS::Lambda"))
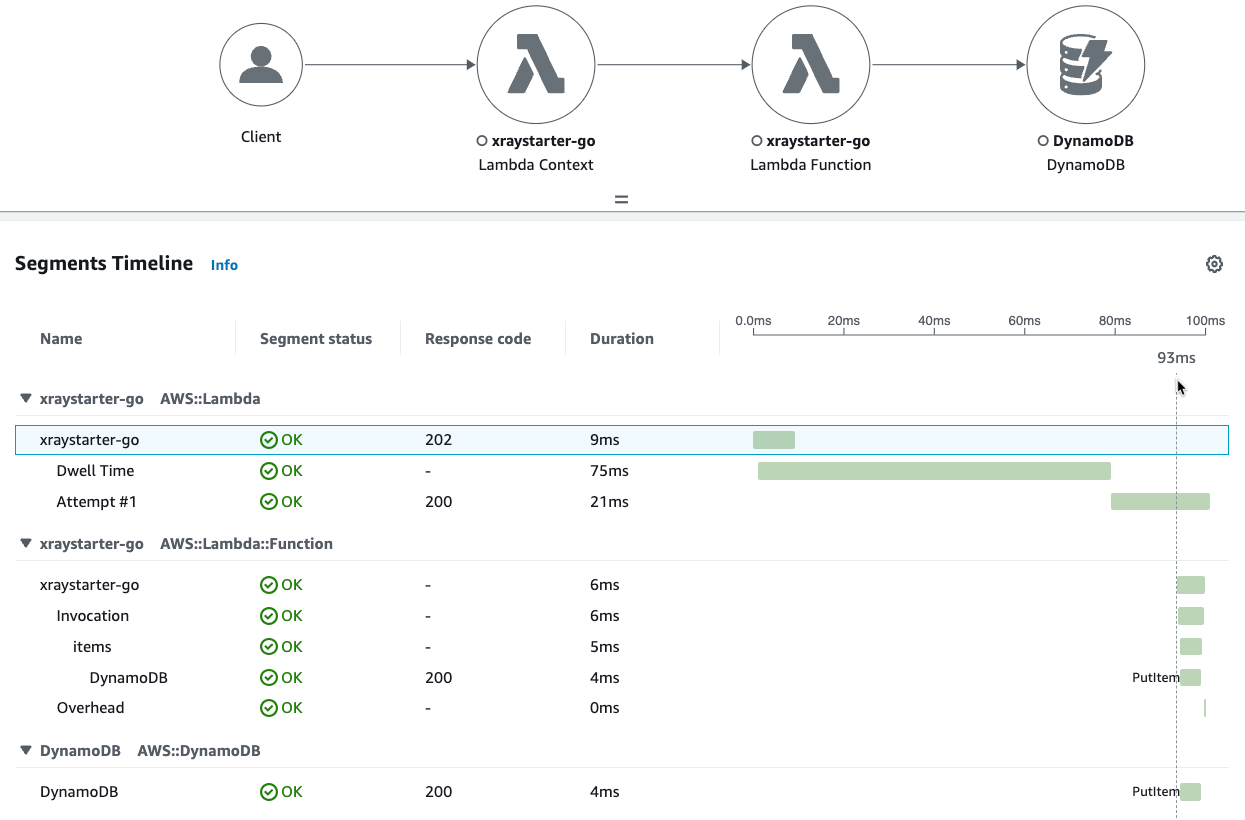
Segments Timeline
Analyze traces
Dwell Time
A surprise is a time spent in the Lambda service, which is 39…92 ms. The next subsegment is a dwell time, which only appears if the lambda is called via SNS/S3.
You can optimize your Function code, but that would not affect the dwell time. Calling the Function directly from the console gives a trace with no dwell time:
DynamoDB
Because the X-Ray trace is sent within the Lambda Function, you do not only measure the response time from DynamoDB but also the performance of the Function and the development language. But don`t take these times seriously because the execution time is also not constant.
An example for the GO Lambda:
| TraceId | Call | Dynamodb Time |
|---|---|---|
| 1-63847262-1f7b1f131c705dd37c779140 | Cold start with event 1 | 81ms |
| 1-63847264-35ce354a5be7eaa51c808a04 | Warm start with same event 1 | 4ms |
| 1-638472d9-0651242b5c645fd552266041 | Warm start with new event 2 | 32ms |
| 1-63847361-4f18e808597dc00552100afe | Warm start with same event 2 | 25 ms |
And the same for Python Lambda
| TraceId | Call | Dynamodb Time |
|---|---|---|
| 1-638475c3-0a4d8fcb05b4bb3c71bf0e28 | Cold start with event 1 | 53ms |
| 1-638475c7-3ca3074d4977478344f0191e | Warm start with same event 1 | 41ms |
| 1-638475d8-4a0ef8842a7bf9b5663412fc | Warm start with new event 2 | 39ms |
| 1-638475d8-4fa68a674581da2f6ba79d1a | Warm start with same event 2 | 34ms |
Conclusion
With X-Ray, you can have traceability and connect them to logs easily! As you dig deeper, you see additional overhead like the initialization or the dwell time. With the service map, you get a quick overview, and the references from traces to CloudWatch logs via Insights can help understand the whole microservice application.
This application is simple, so you can get X-Ray up and running and develop your own applications, which will be more complex. But the principle is the same.
If you need consulting for your serverless project, don’t hesitate to contact the sponsor of this blog, tecRacer.
For more AWS development stuff, follow me on dev https://dev.to/megaproaktiv.
See also
- Code on github: xraystarter
- AWS GO SDK V2 Middleware
- AWS Lambda/X-Ray documentation
- One Observability Workshop
Thanks to
- Spy vs Spy - Comics which not everybody gets :)