Serverless Spy Vs. Spy Chapter 2: AWS Distro for OpenTelemetry Lambda vs X-Ray SDK
We know how to follow traces with the X-Ray SDK. Now there is AWS Distro for OpenTelemetry claiming to do this better. Let’s build CDK examples for Lambda with TypeScript/Python/Go and find out who is the better spy in this game.
Series
-
X-Ray: Getting started with X-Ray on Lambda with TypeScript/Python/Go
-
AWS Distro: AWS Distro for OpenTelemetry Lambda vs X-Ray SDK
-
Send Lambda traces with open telemetry: X-Ray vs Jaeger - Send Lambda traces with open telemetry
-
Telemetry API: Building an AWS Lambda Telemetry API extension for direct logging to Grafana Loki
ADOT - the AWS Distro for OpenTelemetry
Why another instrumentation method for X-Ray?
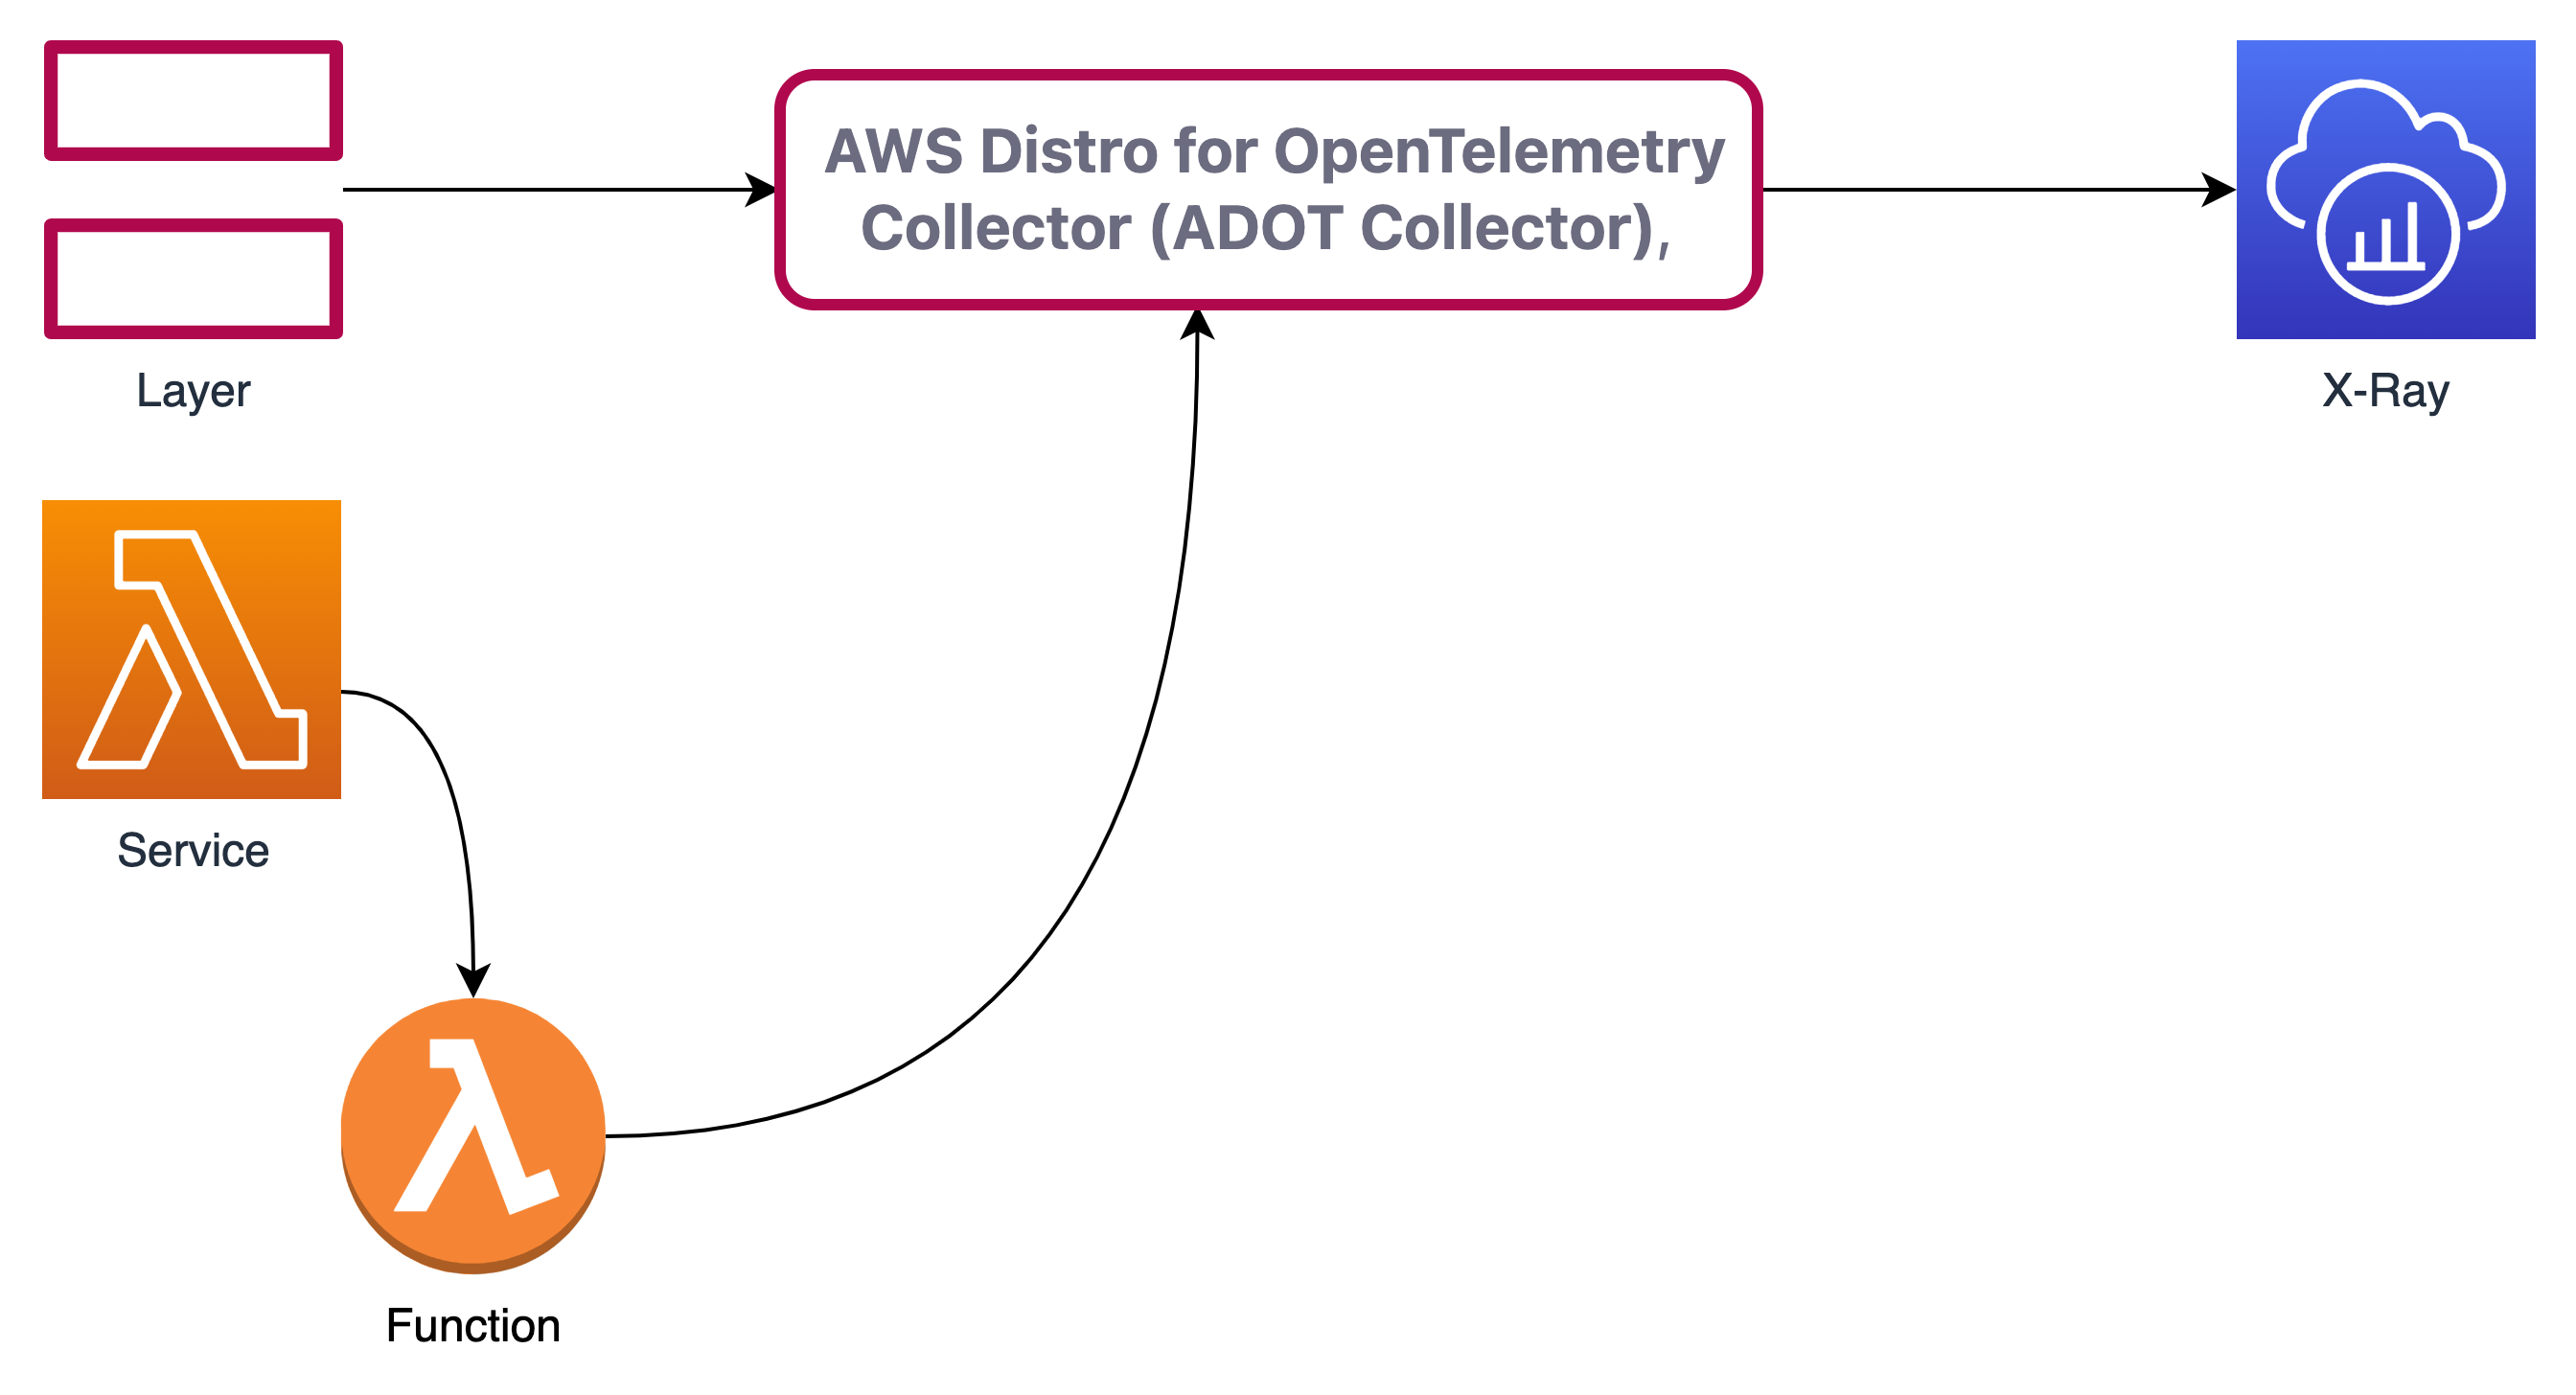
In the AWS-only world, X-Ray is the tracing service to use. But with X-Ray, it is impossible to send traces to other collectors. So the ADOT allows you to use X-Ray as tracing or backends like Jaeger. To use ADOT with Lambda, the ADOT-Lambda Layer comes with a standard configuration for X-Ray.
Choosing between the AWS Distro for OpenTelemetry and X-Ray SDKs
AWS says that X-Ray is for “A tightly integrated single-vendor solution”. With ADOT, you have: “the ability to send traces to multiple different tracing backends without having to re-instrument your code.” See the Exporter column in the ADOT Collector Built-in Components table here for the different possibilities. You can use it with Docker, ECS, EKS and EC2. We will explore the options of the Lambda Layer. For an easy start, it provides an out-of-the-box configuration X-Ray.
Introducing: ADOT & ADOT Lambda Layer
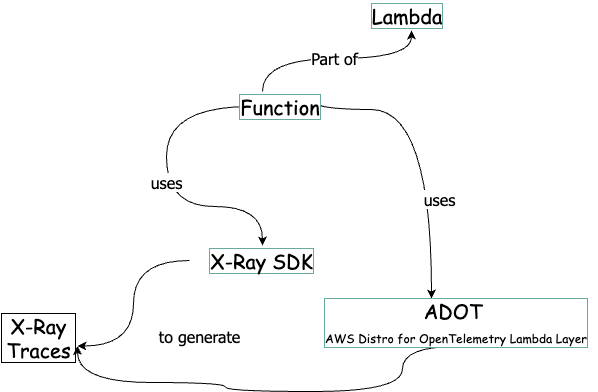
The ADOT Lambda Layer wraps the lambda SDK calls and send them to X-Ray. So far the result is the same as with the X-Ray SDK.
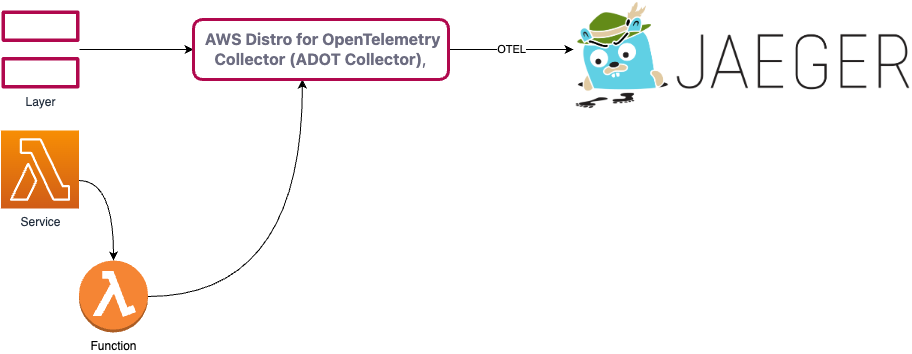
But now it is possible - without changing your Lambda Function code- to export the traces to other targets.
ADOT Lambda Layer available components
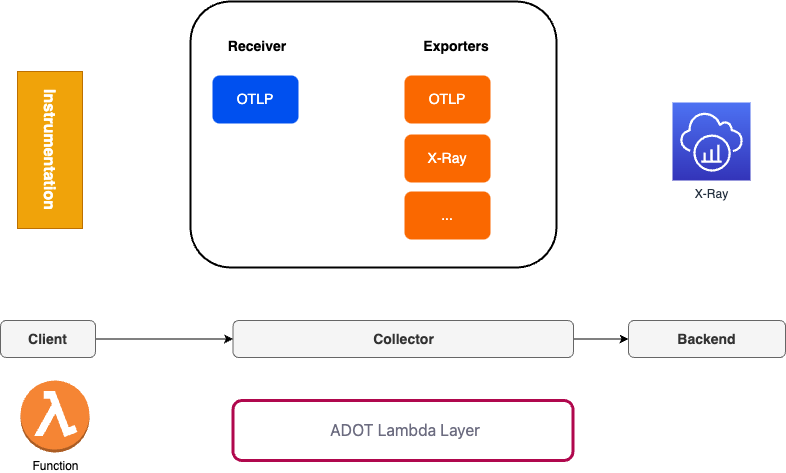
The Layer, called collector, has several components. In this example we use the OTLP receiver and the X-Ray exporter. All available exporters are described in the aws-otel-lambda repository.
The client sends to trace to the receiver side. We tell the collector which exporter should be used. Switching from X-Ray to otel exporter is just a matter of changing a few configuration lines.
The documentation for Lambda gives example code for the different languages. To shorten the long way from example code to running code, I will show you ready-to-run CDK code for Python, Node and GO with a serverless architecture. With Lambda, we are using the AWS X-Ray exporter in the collector. If you want to build your own layer, clone the repo AWS-managed OpenTelemetry Lambda Layers. To do that, learn GO here. You might know the creator of the site 😉 .
Now to the chain of commands 🕵 :
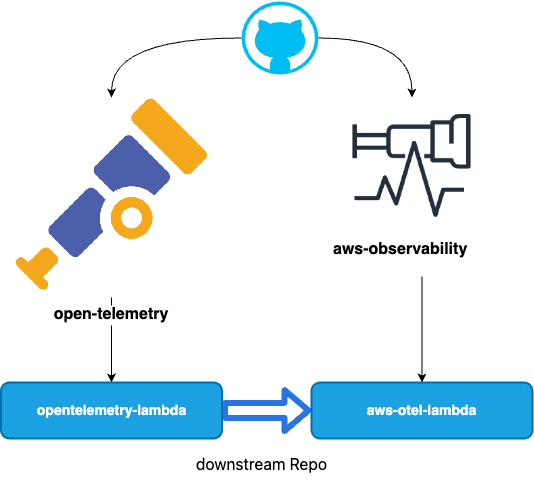
All code is on github. opentelemetry-lambda is a repository from open-telemetry. aws-otel-lambda is a repository from aws-observability. The aws-otel-lambda respository uses opentelemetry-lambda as a submodule. aws-otel-lambda creates the Lambda Layer. Quite confusing in the beginning…
Secrets of the ADOT Lambda Layer
The layer itself can be configured with the config file. With the X-Ray exporter you use the standard configuration:
Config file
receivers:
  otlp:
    protocols:
      grpc:
      http:

exporters:
  logging:
  awsxray:

service:
  pipelines:
    traces:
      receivers: [otlp]
      exporters: [awsxray]
    metrics:
      receivers: [otlp]
      exporters: [logging]
The whole configuration of an collector is documented and specified in the opentelemetry documentation. Please note that you can only use the available components in the Lambda Layer.
The otlp receiver is defined in the
receivers:
  otlp:
Section. It is enables via the service section:
service:
  pipelines:
    traces:
      receivers: [otlp]
      exporters: [awsxray]
So with this configuration the collector sends traces to X-Ray via the Lambda ADOT Layer.
Sources
- https://github.com/open-telemetry/opentelemetry-lambda
- https://github.com/aws-observability/aws-otel-lambda
Make it work: Instrumentation
The instrumentation has two ways, which depend on the development languages. There is auto-instrumentation and manual instrumentation. See the AWS Distro for OpenTelemetry Lambda documentation for details.
Make it work: Auto-Instrumentation with TypeScript/JavaScript and Python
Step 1) Add the ARN of the Lambda Layer to your Lambda Resource
The Layer does to export work for th Lambda function.
Python
arn:aws:lambda:<region>:901920570463:layer:aws-otel-nodejs-<architecture>-ver-1-7-0:2
TypeScript
arn:aws:lambda:<region>:901920570463:layer:aws-otel-python-<architecture>-ver-1-14-0:
Step 2) Enable auto-instrumentation for your Lambda function
Add the environment variable AWS_LAMBDA_EXEC_WRAPPER and set it to /opt/otel-handler. The Function is wrapped with the ADOT Layer. See the section Wrapper scripts in the Lambda Developer Guide.
Step 3) Enable Tracing
Step 4) Add X-Ray Permissions
Extra Steps TypeScript
With using TypeScript as the language, these problems might occur (fixed in the example code):
Older runtimes
The Lambda layer supports Node.JS v14+ Lambda runtimes. For more information about supported JavaScript and Node.JS versions, see the OpenTelemetry JavaScript documentation.
Redefinition of lambdaHandler
You will see the error:
2022-12-03T10:49:40.608Z undefined ERROR Uncaught Exception {"errorType":"TypeError","errorMessage":"Cannot redefine property: lambdaHandler","stack":["TypeError: Cannot redefine property: lambdaHandler"," at Function.defineProperty (<anonymous>)"," at defineProperty (/opt/nodejs/node_modules/shimmer/index.js:14:10)"," at AwsLambdaInstrumentation.wrap [as _wrap] (/opt/nodejs/node_modules/shimmer/index.js:56:3)"," at InstrumentationNodeModuleFile.patch (/opt/nodejs/node_modules/@opentelemetry/instrumentation-aws-lambda/build/src/instrumentation.js:69:26)"," at /opt/nodejs/node_modules/@opentelemetry/instrumentation-aws-lambda/node_modules/@opentelemetry/instrumentation/build/src/platform/node/instrumentation.js:104:29"," at Array.reduce (<anonymous>)"," at AwsLambdaInstrumentation._onRequire (/opt/nodejs/node_modules/@opentelemetry/instrumentation-aws-lambda/node_modules/@opentelemetry/instrumentation/build/src/platform/node/instrumentation.js:101:46)"," at /opt/nodejs/node_modules/@opentelemetry/instrumentation-aws-lambda/node_modules/@opentelemetry/instrumentation/build/src/platform/node/instrumentation.js:131:29"," at Module.Hook._require.Module.require (/opt/nodejs/node_modules/require-in-the-middle/index.js:175:32)"," at Module.Hook._require.Module.require (/opt/nodejs/node_modules/require-in-the-middle/index.js:101:39)"]}
To solve this, change you node file from:
export const lambdaHandler = async (event: any, context: any) =>
const lambdaHandler = async (event: any, context: any) =>
//...
module.exports = { lambdaHandler }
CDK Code in TypeScript
PythonFunction
 const layerPy = "arn:aws:lambda:"+this.region+":901920570463:layer:aws-otel-python-amd64-ver-1-14-0:1"

const fnPy = new PythonFunction(this, 'adotstarter-py', {
  // ....
  runtime: aws_lambda.Runtime.PYTHON_3_8,
  environment: {
    AWS_LAMBDA_EXEC_WRAPPER: "/opt/otel-instrument"
  },
  layers: [
    aws_lambda.LayerVersion.fromLayerVersionArn(this, "layerpy",layerPy)
  ],
  tracing: aws_lambda.Tracing.ACTIVE,
});
NodejsFunction
  const fnTS = new NodejsFunction(this, "adotstarter-ts", {
      // ...
      runtime: aws_lambda.Runtime.NODEJS_16_X,
      tracing: aws_lambda.Tracing.ACTIVE,
      environment: {
        AWS_LAMBDA_EXEC_WRAPPER: "/opt/otel-handler"
      },
      layers: [
        aws_lambda.LayerVersion.fromLayerVersionArn(this, "layerts",layerTS)
      ],
    })
More Work: Manual instrumentation with GO
Step 1) Add the ADOT Layer
With CDK in go:
adotLayer := lambda.LayerVersion_FromLayerVersionArn(this, aws.String("adotlayer"),
		aws.String("arn:aws:lambda:eu-central-1:901920570463:layer:aws-otel-collector-amd64-ver-0-62-1:1"))
	fn := lambda.NewFunction(this, aws.String("adotlambda"),
	&lambda.FunctionProps{
        //...
		Runtime: lambda.Runtime_PROVIDED_AL2(),
		Tracing: lambda.Tracing_ACTIVE,
		Layers: &[]lambda.ILayerVersion{
				adotLayer,
		},
		},
	)
With CDK in TypeScript:
const layerGo = "arn:aws:lambda:"+this.region+":901920570463:layer:aws-otel-collector-amd64-ver-0-62-1:1"
const fnGO = new aws_lambda.Function(this, 'adotstarter-go', {
  // ....
  layers: [
    aws_lambda.LayerVersion.fromLayerVersionArn(this, "layerGO",layerGo)
  ],
  runtime: aws_lambda.Runtime.PROVIDED_AL2,
  tracing: aws_lambda.Tracing.ACTIVE,
});
| Attribute | ADOT Value |
|---|---|
| Runtime | Runtime_PROVIDED_AL2 instead of go_1x |
| Tracing | active |
| Layer | region specific |
Format: arn:aws:lambda:<region>:901920570463:layer:aws-otel-collector-<architecture>-ver-0-62-1:1
Possible Error deploying go
Building you GO lambda with ADOT you might note an error, indicated in the X-Ray map. This is fixed in the example code.
RequestId: 3000d031-1216-4586-baa0-c1725fd4bcec Error: Couldn't find valid bootstrap(s): [/var/task/bootstrap /opt/bootstrap] Runtime.InvalidEntrypoint
...
@message
RequestId: 3000d031-1216-4586-baa0-c1725fd4bcec Error: Couldn't find valid bootstrap(s): [/var/task/bootstrap /opt/bootstrap]
...
This is because the go main file has to be named “bootstrap” with Lambda provided runtime.
Building the deployment package should look like:
env GOOS=linux GOARCH=amd64 CGO_ENABLED=0 go build -ldflags="-s -w" -o dist/main main/main.go
chmod +x dist/main
mv dist/main dist/bootstrap
cd dist && zip main.zip bootstrap
The GOARCH argument ensures x64 architecture, even if your workstation has arm architecture like Mac M1.
And you solved the error:
Step 2) Instrument in App Code
Includes
"go.opentelemetry.io/contrib/instrumentation/github.com/aws/aws-lambda-go/otellambda"
"go.opentelemetry.io/contrib/instrumentation/github.com/aws/aws-lambda-go/otellambda/xrayconfig"
"go.opentelemetry.io/contrib/instrumentation/github.com/aws/aws-sdk-go-v2/otelaws"
"go.opentelemetry.io/contrib/propagators/aws/xray"
"go.opentelemetry.io/otel"
Instrument
	// Instrument all AWS clients.
	otelaws.AppendMiddlewares(&cfg.APIOptions)
	// Create an instrumented S3 client from the config.
	Client = dynamodb.NewFromConfig(cfg)
Set context/create trace provider
ctx := context.Background()

tp, err := xrayconfig.NewTracerProvider(ctx)
Start
lambda.Start(otellambda.InstrumentHandler(HandleRequest, xrayconfig.WithRecommendedOptions(tp)... ))
func HandleRequest(ctx context.Context, s3Event events.S3Event) (string, error) {
	//...
    putItem(ctx,s3input)
}
The prepared context is propagated to the AWS API Calls.
func putItem(ctx context.Context, itemID string){
	result, err := Client.PutItem(ctx,input)
    //...
}
Step 3) Add X-Ray Permissions
In CDK/TS
fnTS.addToRolePolicy( new aws_iam.PolicyStatement(
  {
    sid: "xraywrite",
    actions: [
      "xray:*"
    ],
    resources: ["*"],
    effect: aws_iam.Effect.ALLOW,
  }
))
Feel free to make it more “least privileges”.
Customizing the connector
To customize the collector configuration, add a configuration yaml file to your function code. Once the file has been deployed with a Lambda function, create an environment variable on your Lambda function OPENTELEMETRY_COLLECTOR_CONFIG_FILE and set it to /var/task/<path//var/task/ because that is the working directory for your Lambda function
We will cover that in the next chapter.
Getting started / Walkthrough
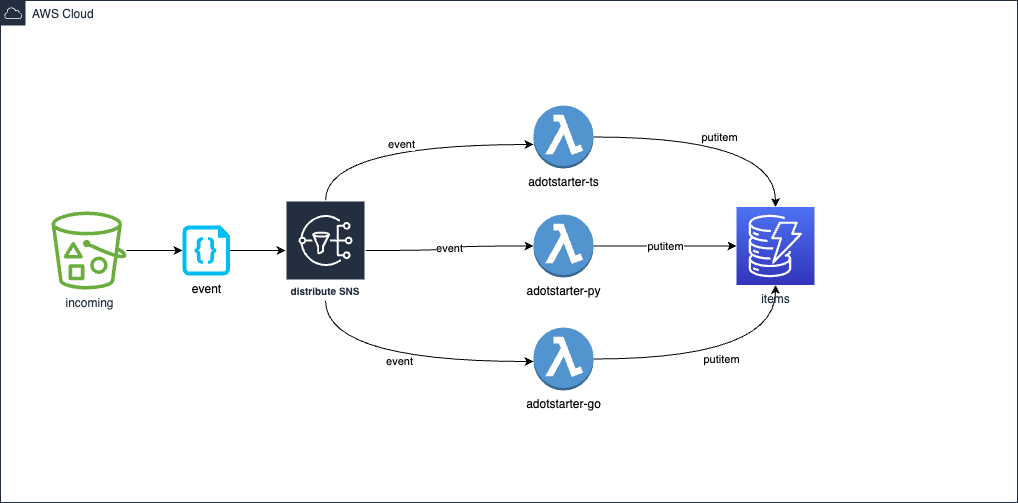 This is my architecture
Assuming node, cdk ,python, go and task are installed. Also you need docker or colima
Without tasks have a look into the Taskfile.yml to see what each step is doing.
Clone source
Do:
git clone https://github.com/megaproaktiv/adot-xraystarter.git
cd adot-xraystarter
npm i
Output:
cd adot-xraystarter
npm i
Cloning into 'adot-xraystarter'...
remote: Enumerating objects: 40, done.
remote: Counting objects: 100% (40/40), done.
remote: Compressing objects: 100% (30/30), done.
remote: Total 40 (delta 4), reused 40 (delta 4), pack-reused 0
Receiving objects: 100% (40/40), 122.56 KiB | 618.00 KiB/s, done.
Resolving deltas: 100% (4/4), done.
npm WARN deprecated w3c-hr-time@1.0.2: Use your platform's native performance.now() and performance.timeOrigin.

added 362 packages, and audited 381 packages in 8s

29 packages are looking for funding
  run `npm fund` for details

found 0 vulnerabilities
Start docker or colima
Do (Mac only):
task colima
Output:
task: [colima] colima start
INFO[0000] starting colima
INFO[0000] runtime: docker
INFO[0000] preparing network ...                         context=vm
INFO[0000] starting ...                                  context=vm
INFO[0021] provisioning ...                              context=docker
INFO[0021] starting ...                                  context=docker
INFO[0026] done
Please note:
To use colima with the AWS CDK, you should set:
export  DOCKER_BUILDKIT=0
export  COMPOSE_DOCKER_CLI_BUILD=0
export  DOCKER_DEFAULT_PLATFORM="linux/amd64"
export  DOCKER_SCAN_SUGGEST=false
When you use task, these environment variables are set in the Taskfile.
Or start docker desktop and pay Docker license.
Boostrap
If you did not already bootstrap your account for AWS-CDK.
Do:
task bootstrap
Output:
task: [bootstrap] npx cdk@2.51.1  bootstrap
 ⏳  Bootstrapping environment aws://139008737997/eu-central-1...
CDK Deploy
Do:
task deploy
Output:
adding: bootstrap (deflated 62%)
Sending build context to Docker daemon  54.27kB
...
Successfully built 695a35fa02f6
...
adotstarter-auto: building assets...
adotstarter-auto: creating CloudFormation changeset...

 ✅  adotstarter-auto
 ...
 ✨  Deployment time: 56.54s

Outputs:
adotstarter-auto.BucketName = adotstarter-auto-incoming0b397865-wjebxt7dtthq
adotstarter-auto.LambdaNameGo = adotstarter-go
adotstarter-auto.LambdaNamePy = adotstarter-py
adotstarter-auto.LambdaNameTS = adotstarter-ts
adotstarter-auto.TableName = items
Stack ARN:
arn:aws:cloudformation:eu-central-1:139008737997:stack/adotstarter-auto/865c51a0-77b0-11ed-b5f7-02301166f434
✨  Total time: 90.27s
You see that I used the standard lambda function only with go. That is just because its faster.
To update function code, each lambda directory has a task fastdeploy task which will update the function code onyl.
lambda
├── go
│   ├── Taskfile.yml
│   ├── dist
│   ├── go.mod
│   ├── go.sum
│   └── main
├── py
│   ├── Taskfile.yml
│   ├── __init__.py
│   ├── app.py
│   └── requirements.txt
└── ts
    ├── Taskfile.yml
    ├── index.ts
    ├── package-lock.json
    ├── package.json
    ├── test
    └── tsconfig.json
Generate traffic
Do:
task traffic
Output:
...
upload: ./readme.md to s3://adot-starter-incomingadotb2268a57-1rta809pp5ngv//test-20-0
...
Stop it after a few uploads.
Inspect the new ADOT Service Map
Now you can open the X-Ray map in the (new) AWS console, e.g. X-Ray eu-central-1. You find the new X-Ray pages in the sidebar from CloudWatch.
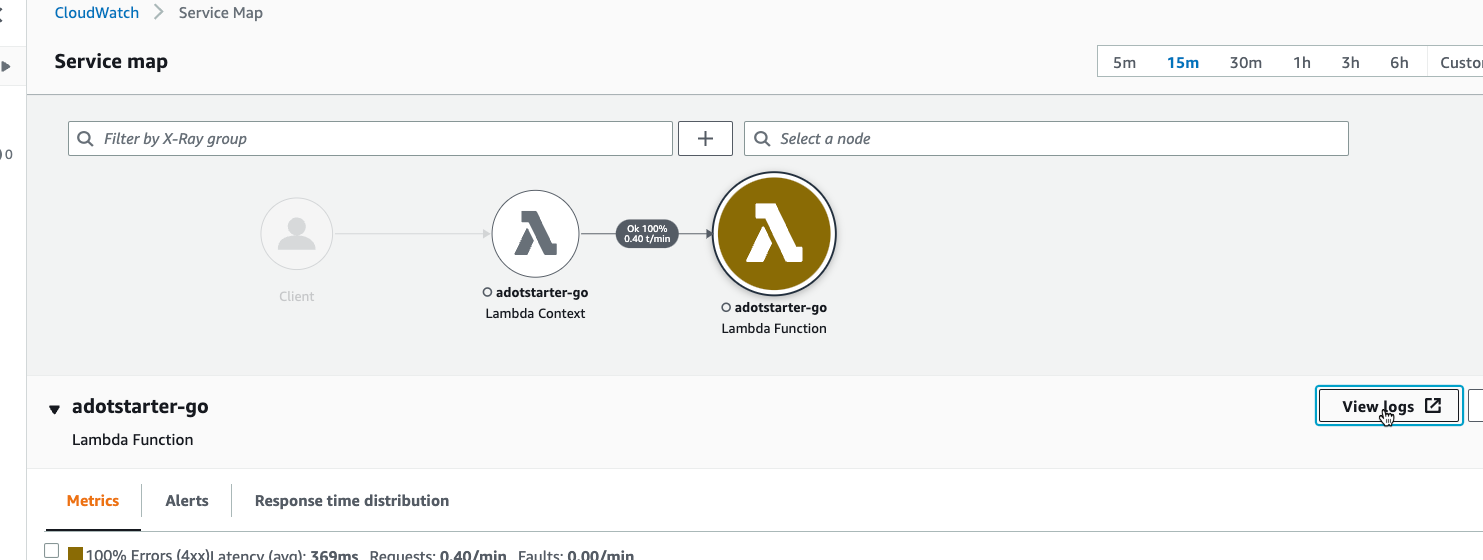
New Map: X-Ray Service Map ADOT
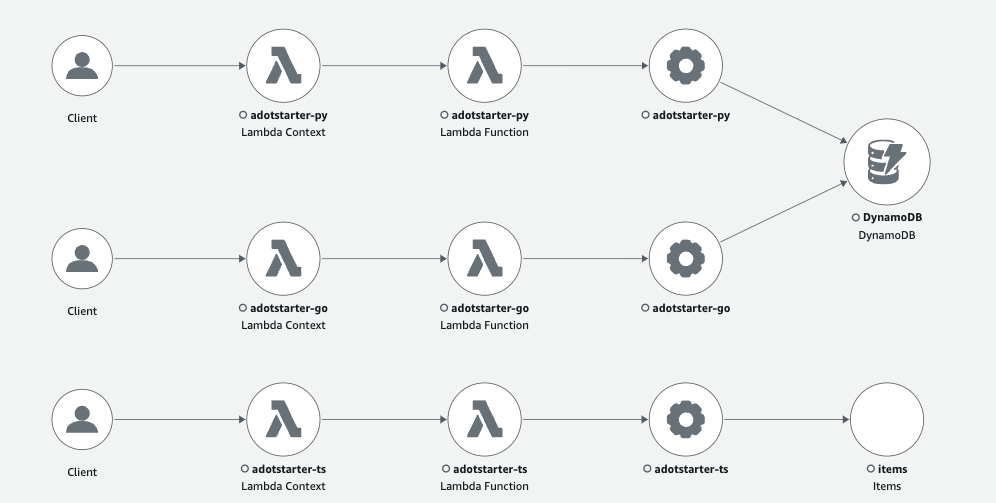
You should see the Service map for all three functions.
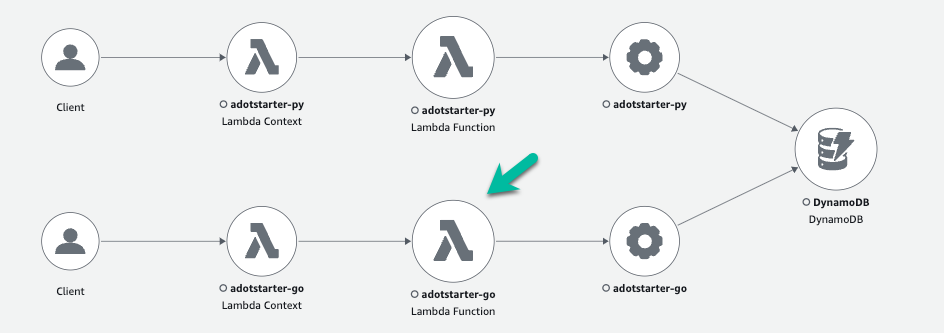
Old Map: X-Ray Service Map X-Ray SDK
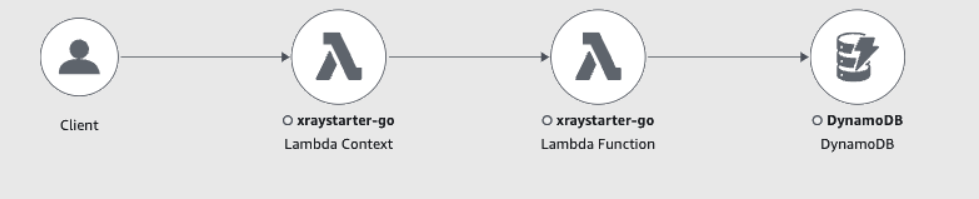
The difference to the old map X-Ray SDK trace is, that there is an new node after the Lambda Function node. This can change is further version.
GO ADOT - X-Ray - Timing issue?
You may notice small changes in the timing because of the added Layer. But also the GO Function switched from “native” Lambda-Go to an provided runtime. The provided runtime is needed for the ADOT Layer. So both switches have effects.
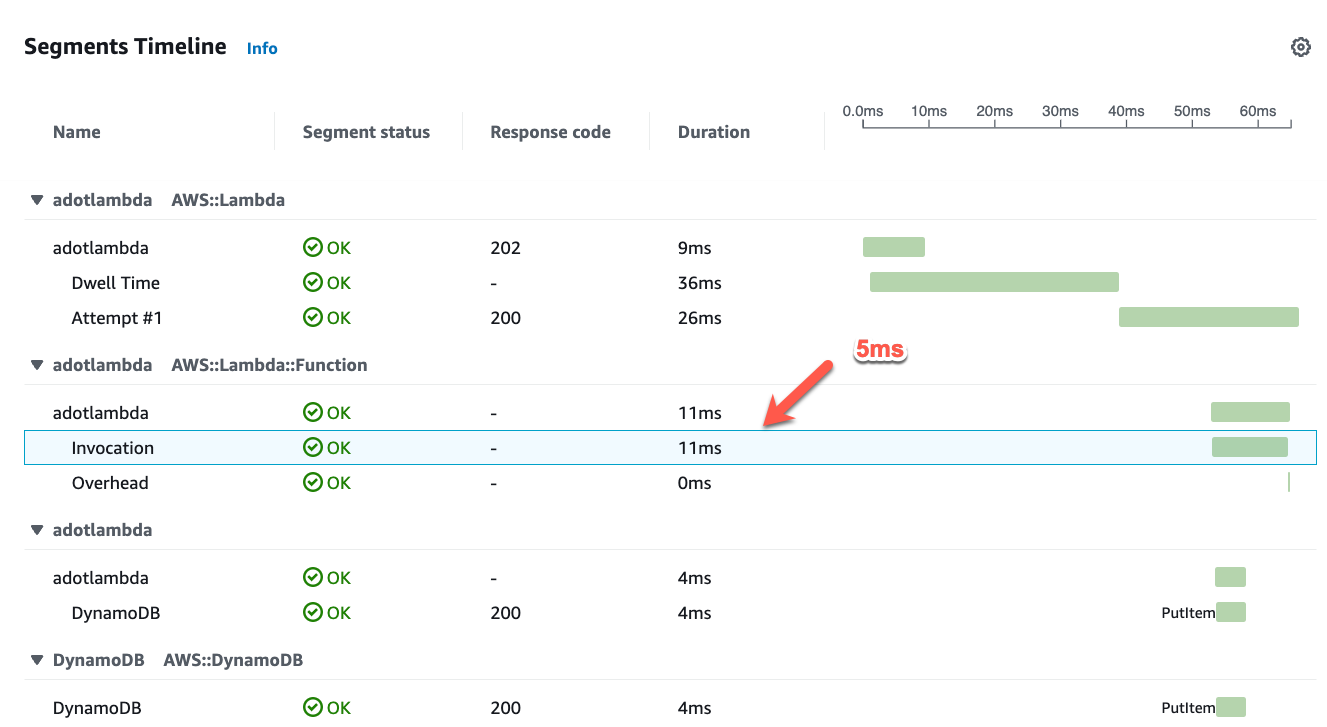 Timing ADOT go
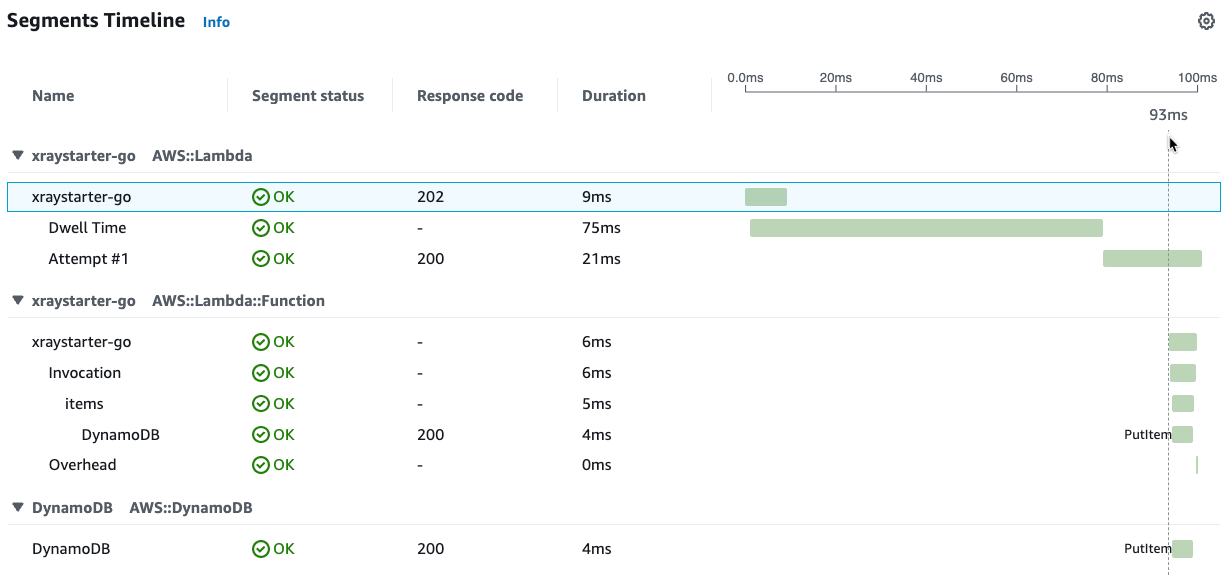 Timing X-Ray go
TypeScript ADOT - X-Ray - faster?
TypeScript seems to be a little bit faster with ADOT. To investigate further we would have to look at many samples to filter out statistical noise.
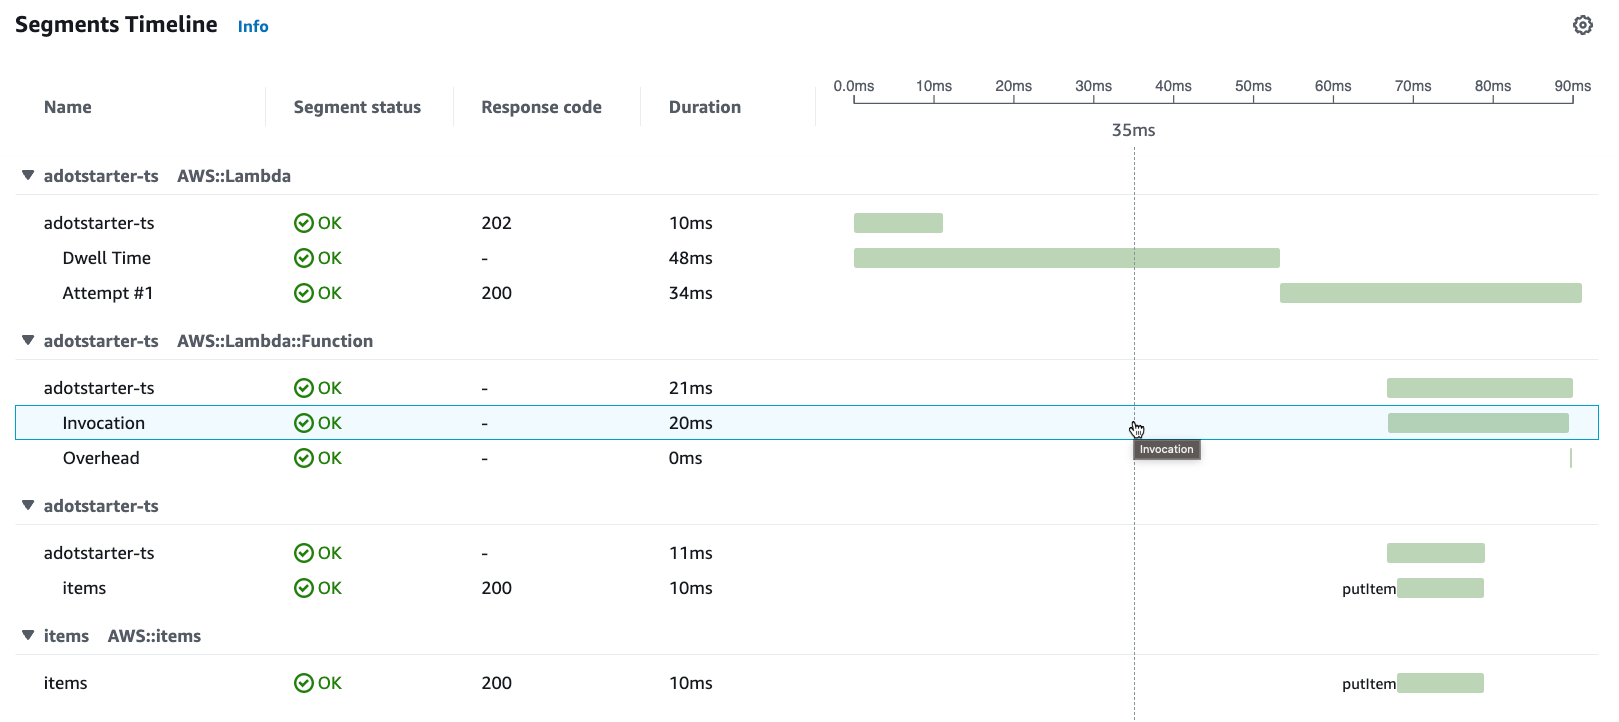 Timing ADOT TypeScript
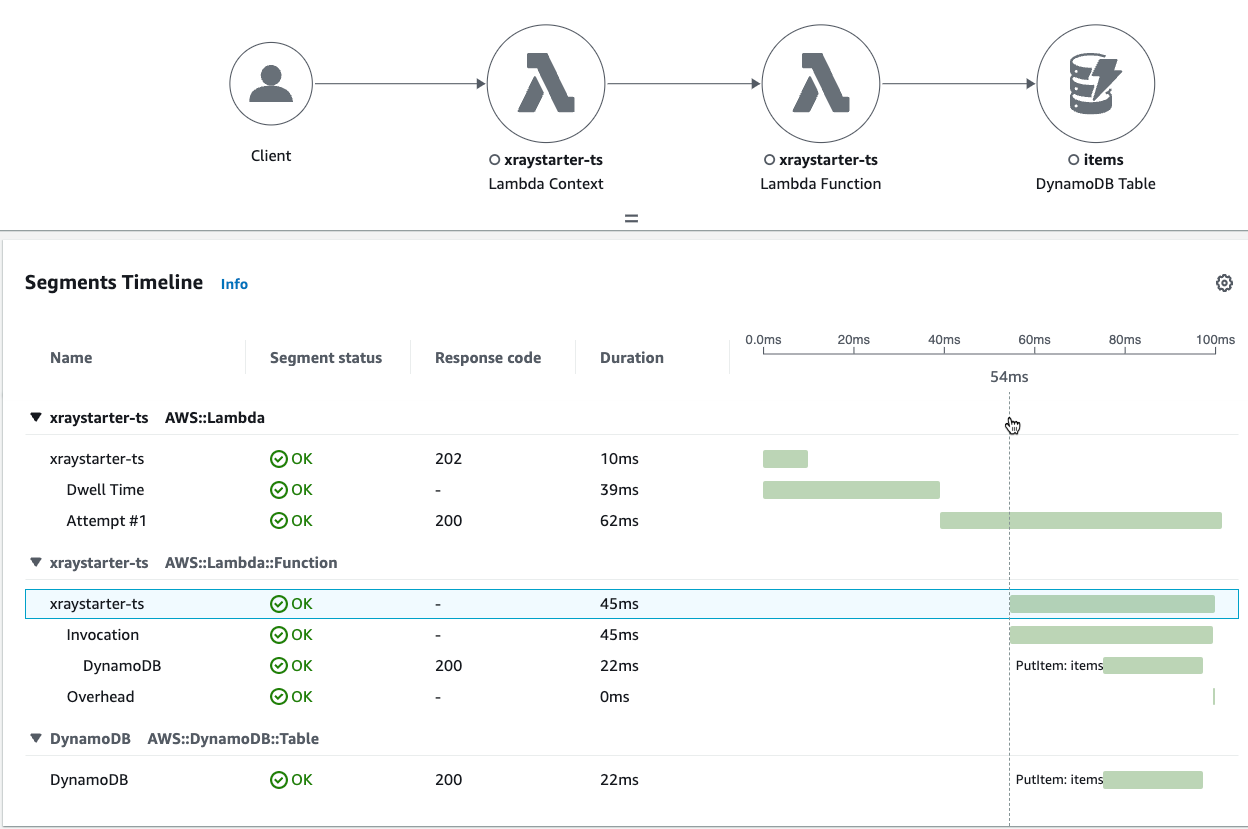 Timing X-Ray TypeScript
Python ADOT vs X-Ray slower?
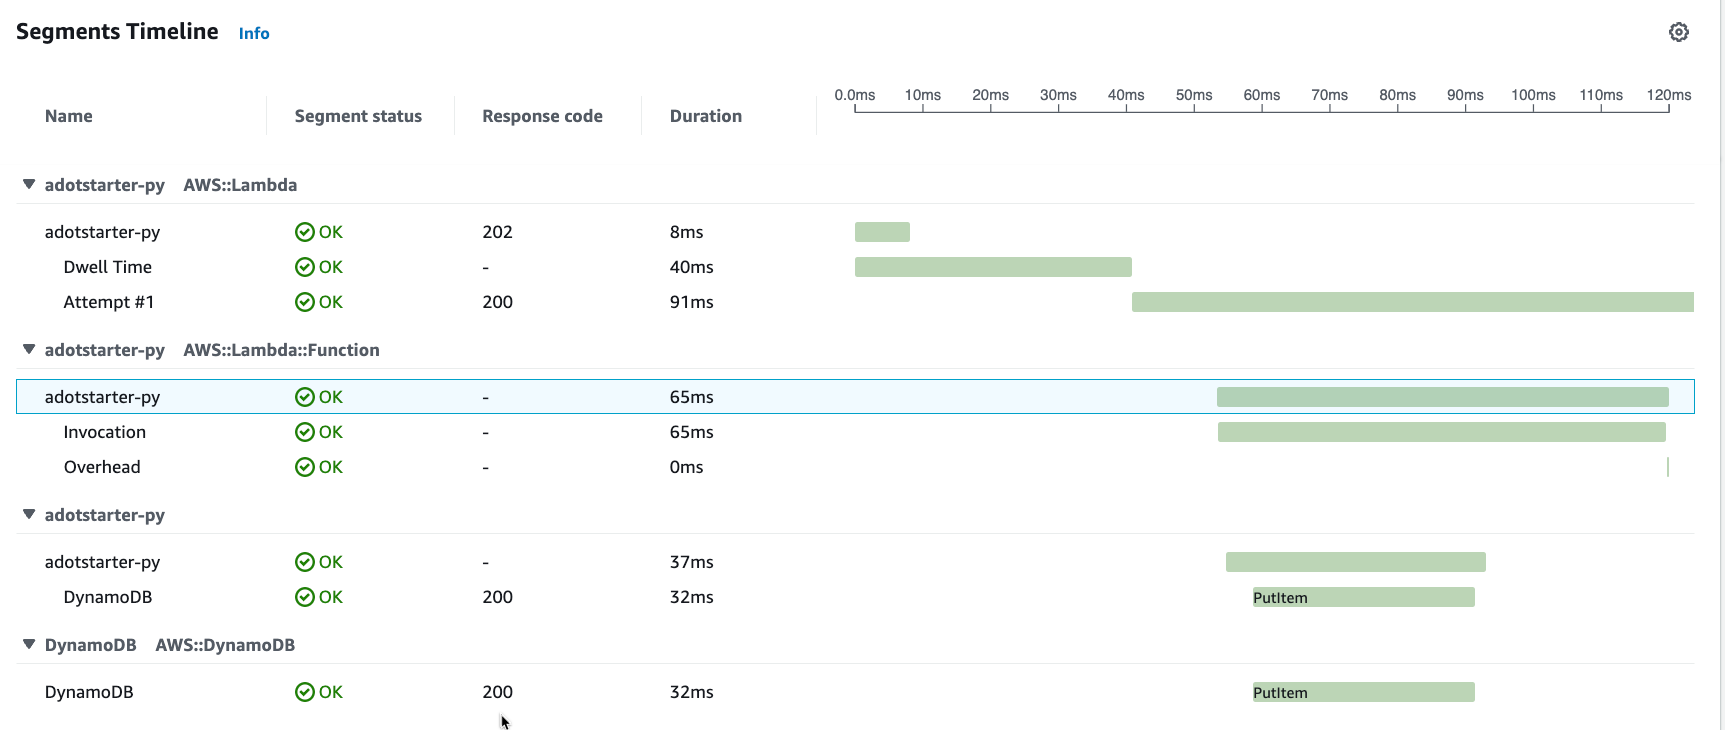 Timing ADOT Python
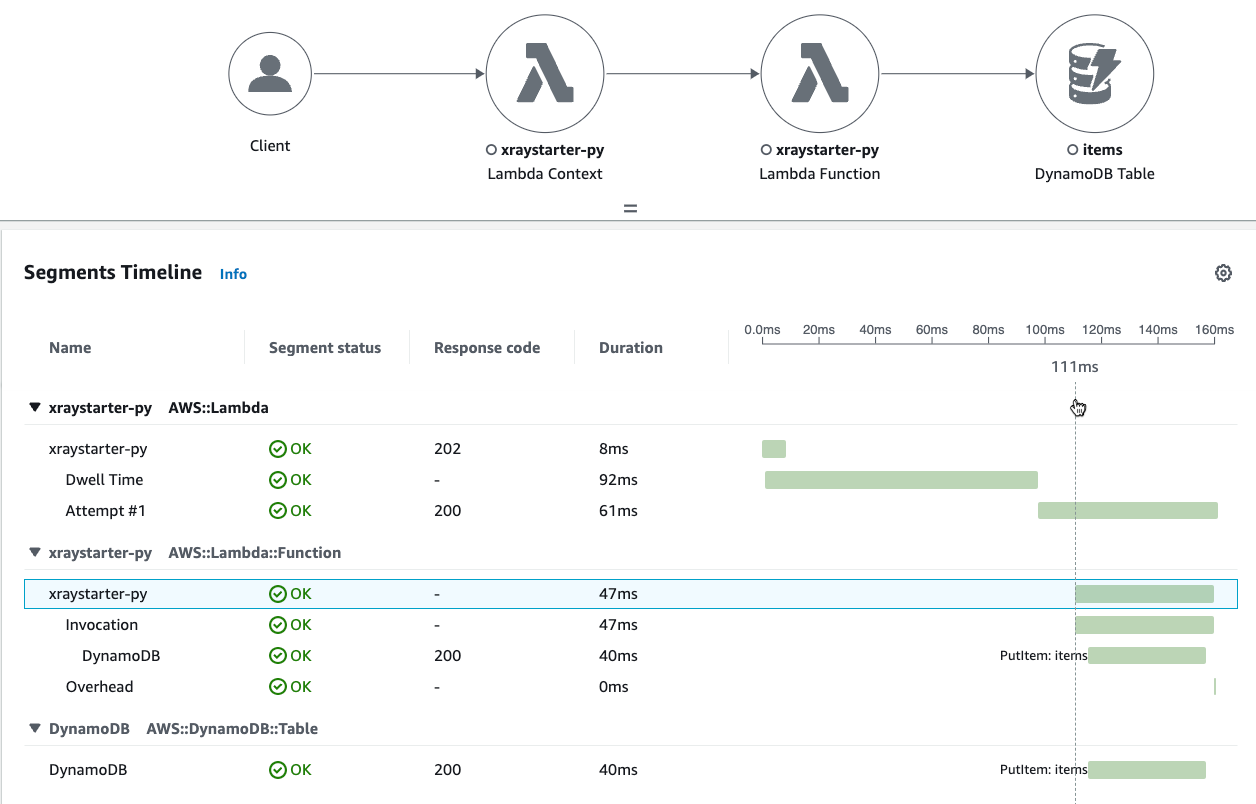 Timing X-Ray Python
Conclusion: Should I use X-Ray SDK or ADOT?
The instrumentation of a Lambda Function with Python and TypeScript is relatively easy. The instrumentation in go seems more complex. If you want to send additional attributes or metadata, you will also need OTEL SDKs for your Lambda Functions. The trend is going in the OTEL direction, so AWS recommends ADOT for your future projects.
I found the new namings, concepts and repositories complex in the beginning. So I hope you found some clarity with this blog post!
In the next chapter, we will send OTEL traces.
If you need consulting for your serverless project, don’t hesitate to contact the sponsor of this blog, tecRacer.
For more AWS development stuff, follow me on dev https://dev.to/megaproaktiv.
See also: Sources and Documentation Links
Thanks to
The observation guys B&B for insightful discussions about observability: Bernd&Benjamin