Custom runtime on Amazon Linux 2 - GO outperforms Node (3x) and Python (2x) with AWS Lambda Cold-start time
Lambda GO runtime is deprecated until the end of 2023. The new default custom Amazon Linux 2 runtime really speeds things up for GO. Now the cold-start is 2x faster than Python and 3x faster than node!
How to measure cold start
Creating new micro-vms
You could wait until the Lambda service removes a Lambda micro-vm. Because it`s not defined when that happens, we use a trick.
Each time you change a Environment variable of the Lambda Resource, a new environment is created. And a new cold start the next time you invoke Lambda.
Call function
Before we begin a measurement cycle, all log streams of the lambda log groups are deleted. Then a simple lambda is invoked 10 times. This creates - after some time, waiting up to 10 seconds, the CloudWatch logs REPORT entries. With 10 times invokation I want to average out static effects.
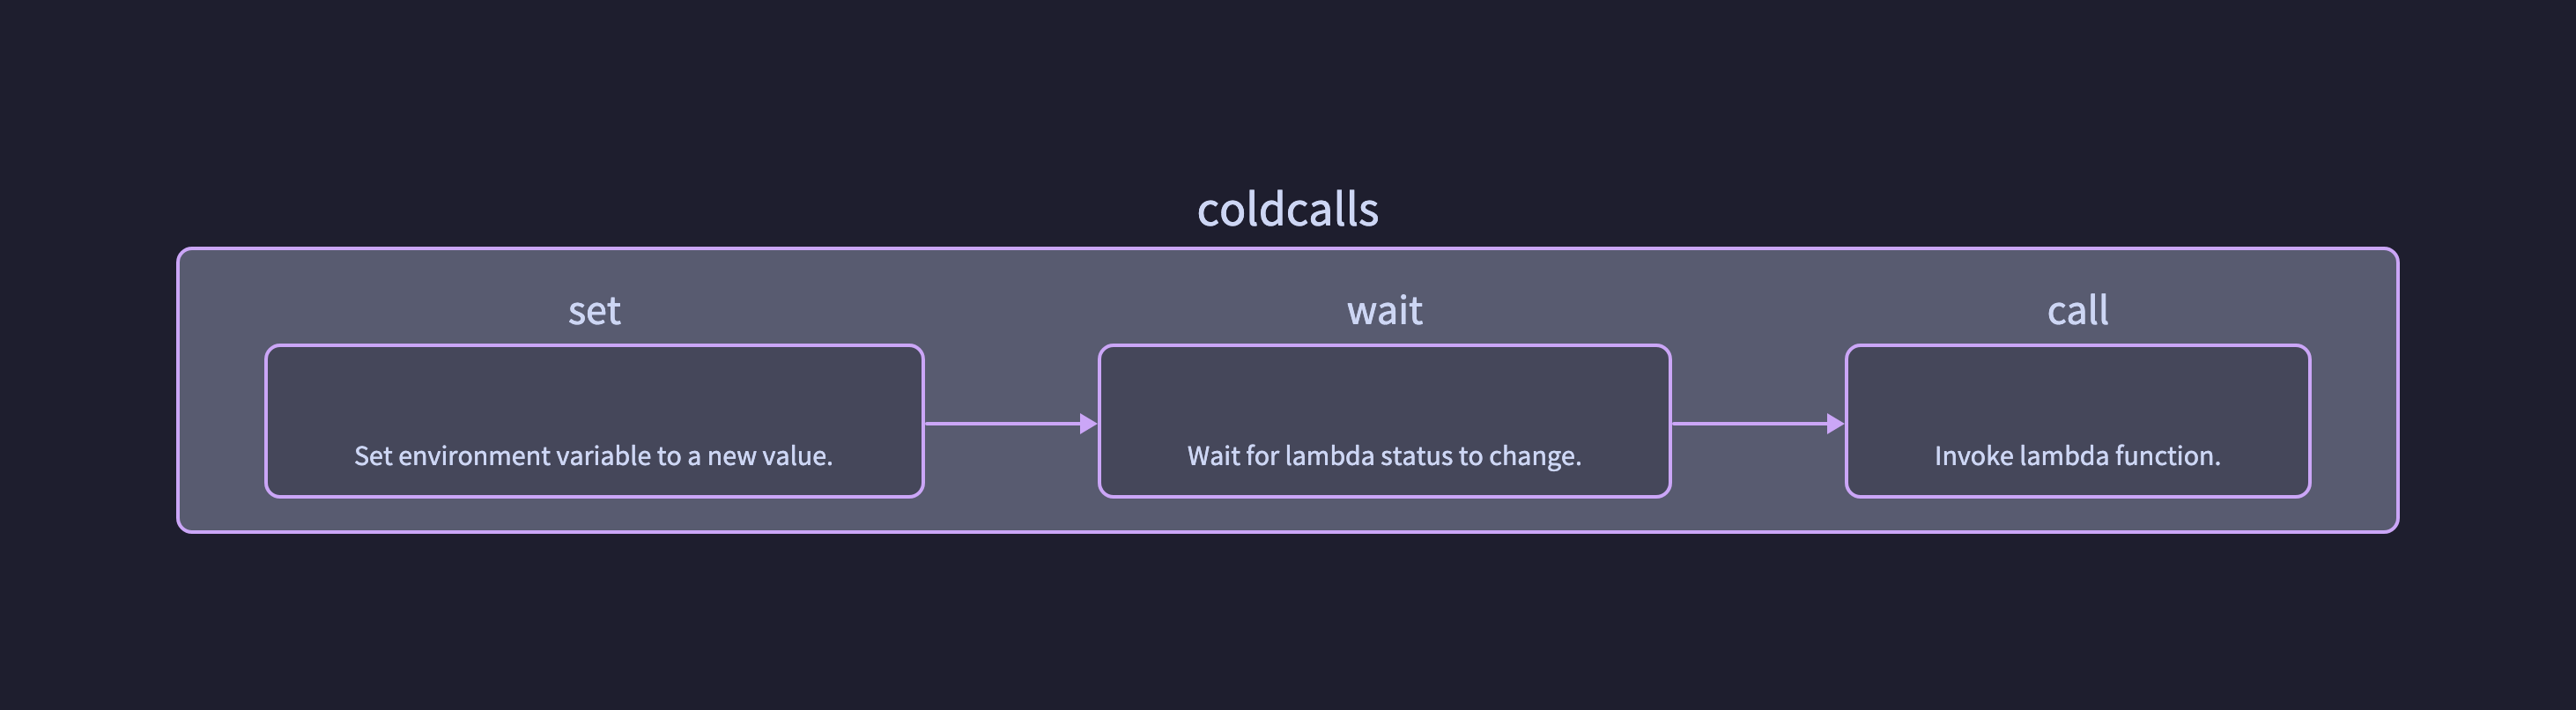
- set: Set environment to new value
- wait: Poll Lambda
Configuration.LastUpdateStatusofGetFunctionuntil readyLastUpdateStatusSuccessful - call: Invoke Lambda function
Getting the “REPORT” logs.
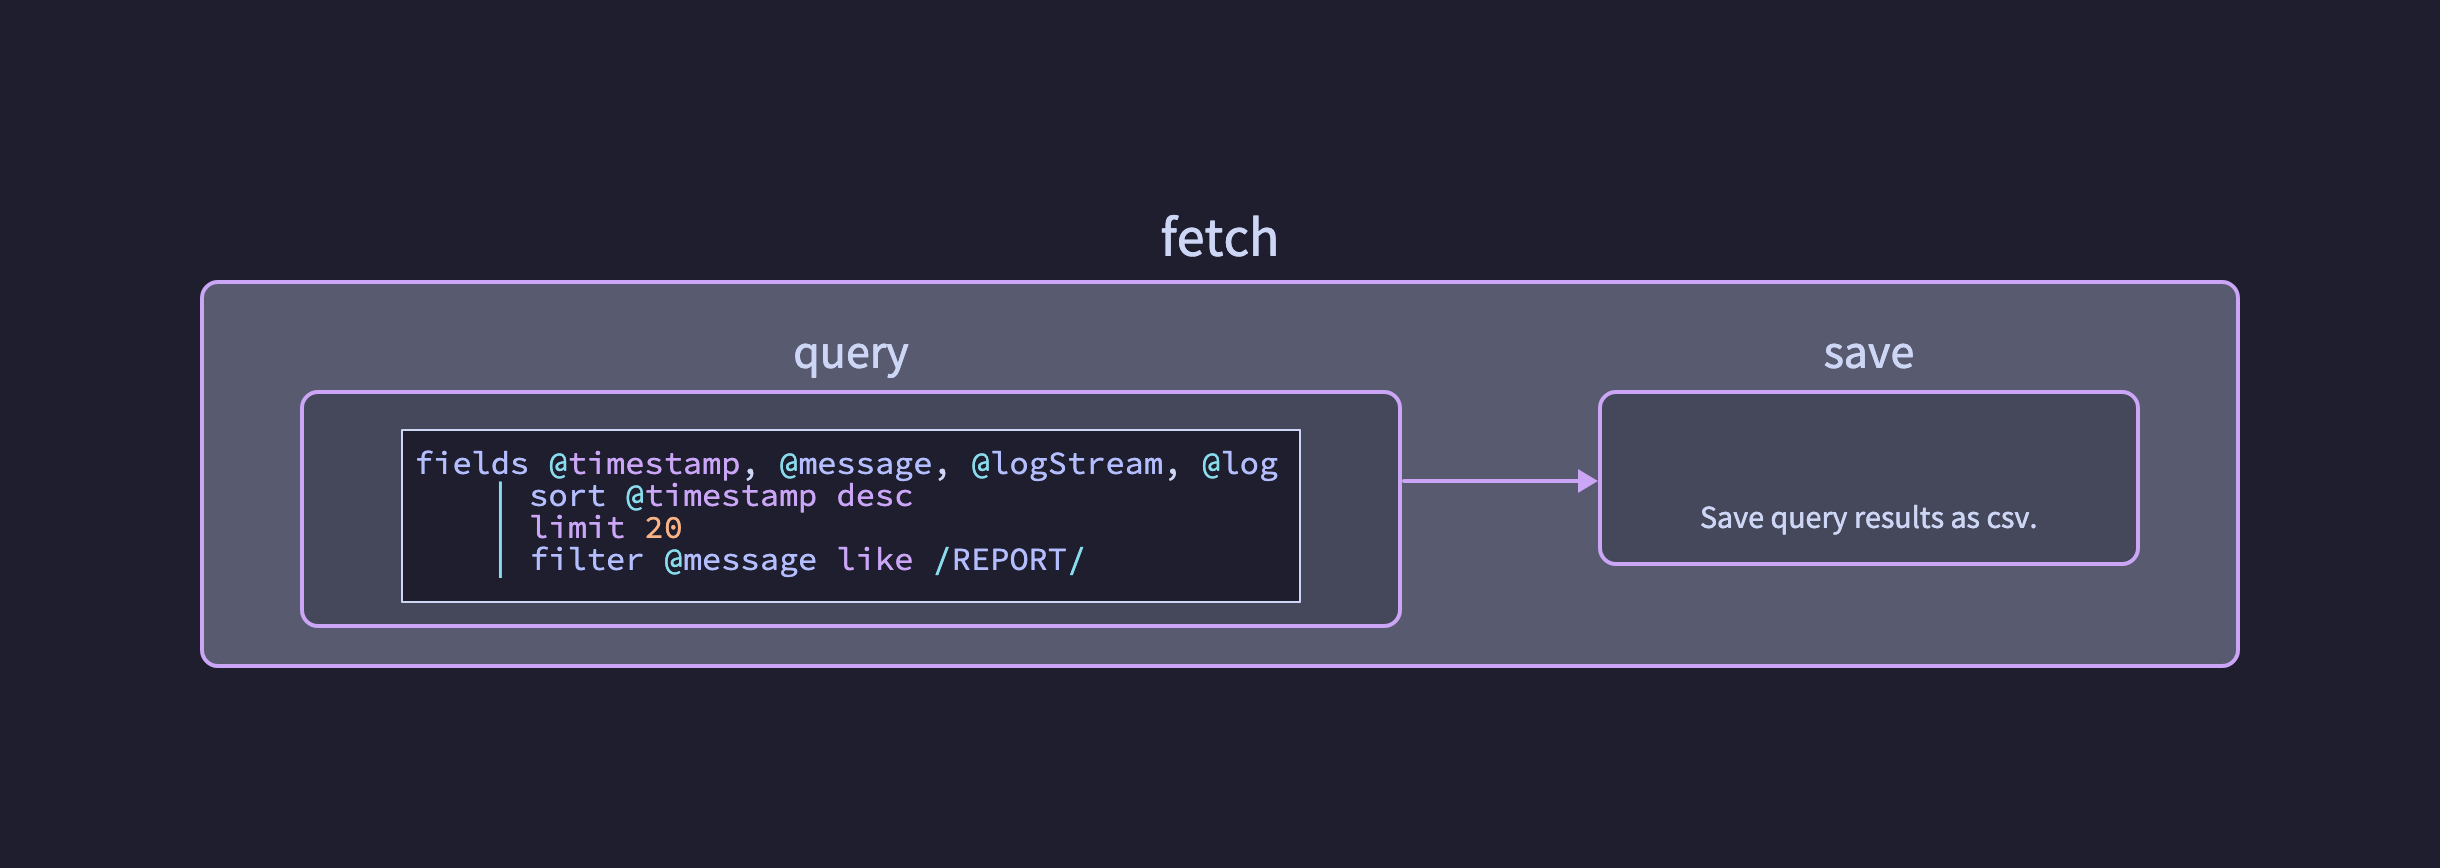
To get all “REPORT” entries, I can use the CloudWatch logs API to use Insights.
The query is started with StartQuery, then you call GetQueryResults until the status is QueryStatusComplete. In the second step, fetchreport saves all lines as csv file.
Example:
REPORT RequestId: f4ac073d-e814-456a-bbfb-d41b5b485c28 Duration: 2.72 ms Billed Duration: 3 ms Memory Size: 2048 MB Max Memory Used: 64 MB Init Duration: 166.76 ms
becomes
Name;Memory;Init;Cold;Billed
hello-node;2048;166.76;2.72;3
Display results with “R”
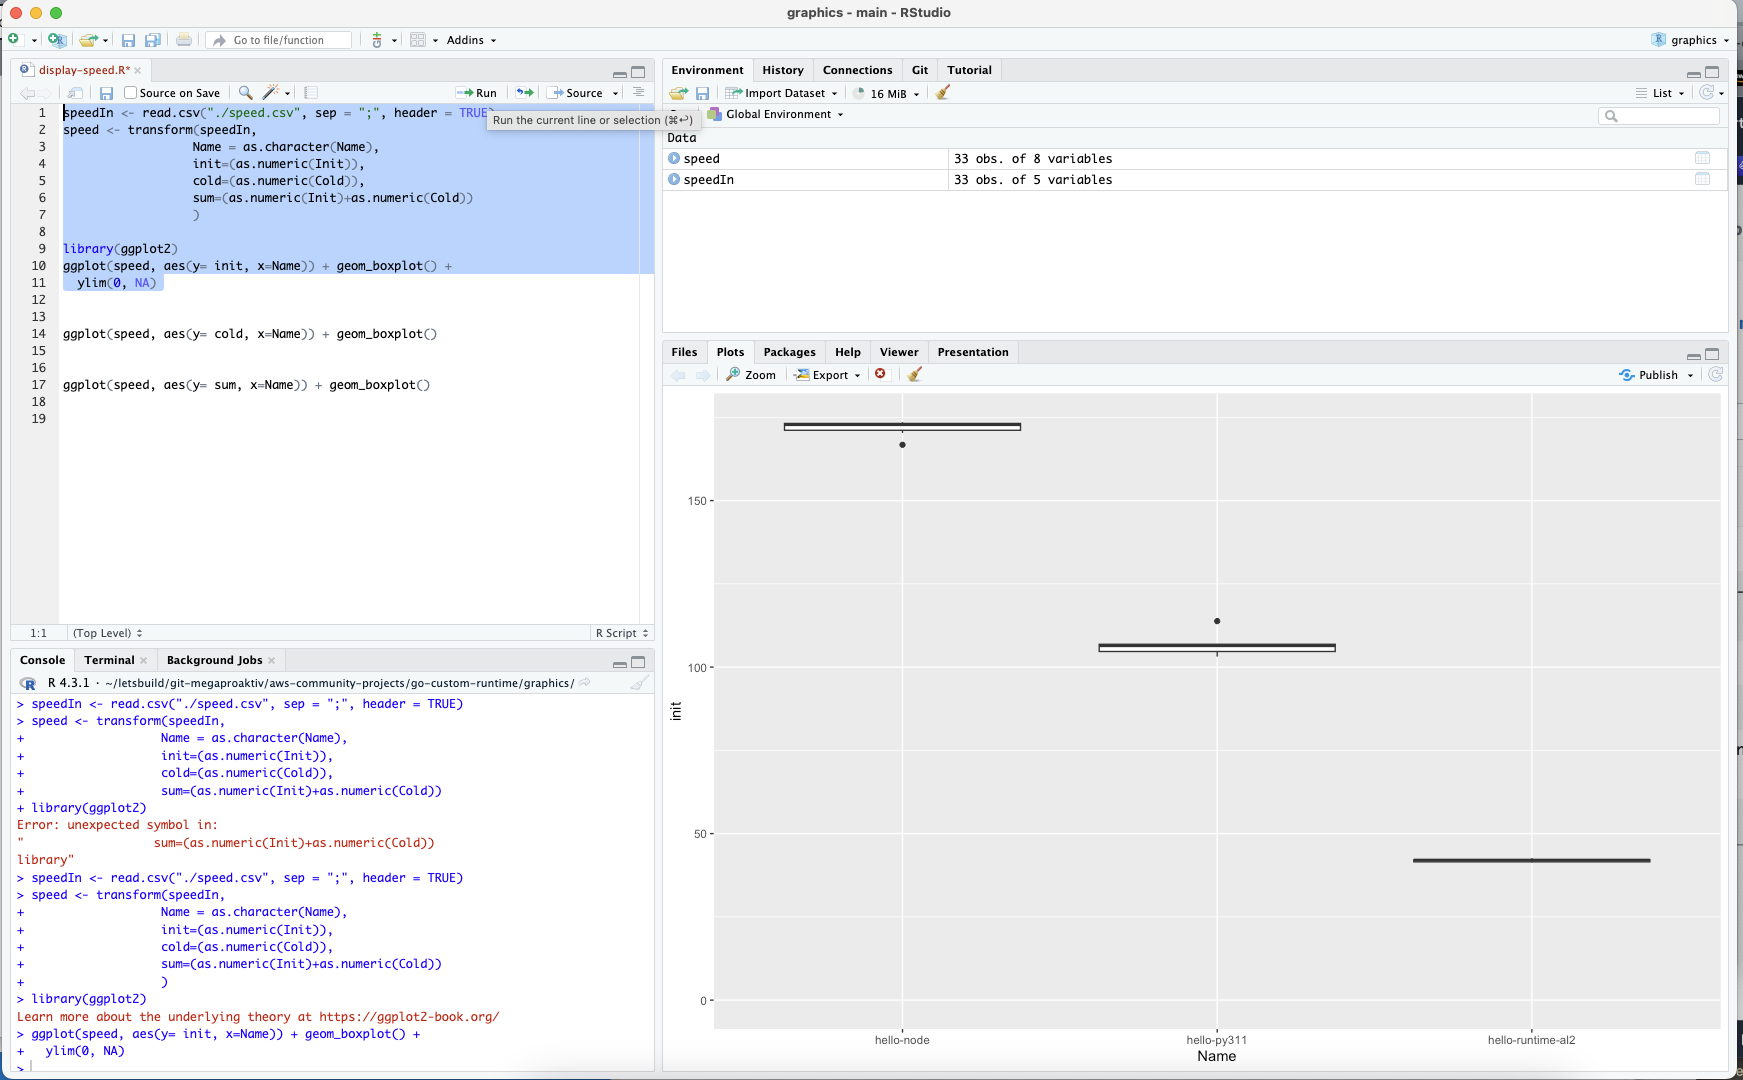
With R a plot is created:
speedIn <- read.csv("./speed.csv", sep = ";", header = TRUE)
speed <- transform(speedIn,
                  Name = as.character(Name),
                  init=(as.numeric(Init)),
                  cold=(as.numeric(Cold)),
                  sum=(as.numeric(Init)+as.numeric(Cold))
                  )

library(ggplot2)
ggplot(speed, aes(y= init, x=Name)) + geom_boxplot() +
  ylim(0, NA)
- Read:
read.csvthe whole csv file is read into a single variablespeedIn. - Transform:
transformstrings are translated into numbers. - Plot: with the powerful library ggplot2 a boxplot is created.
Results
x86, 128M
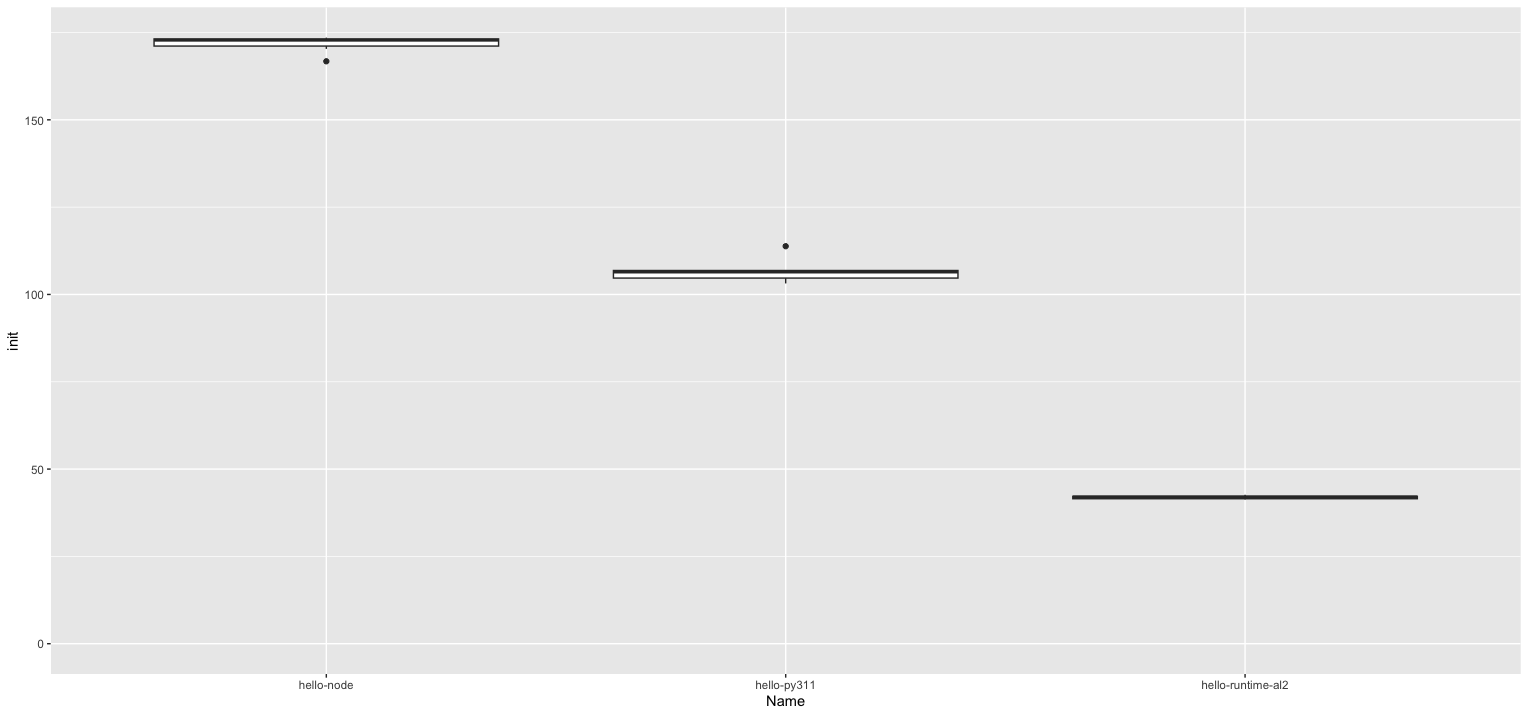
The first plot shows the default architecture x86 with 128M.
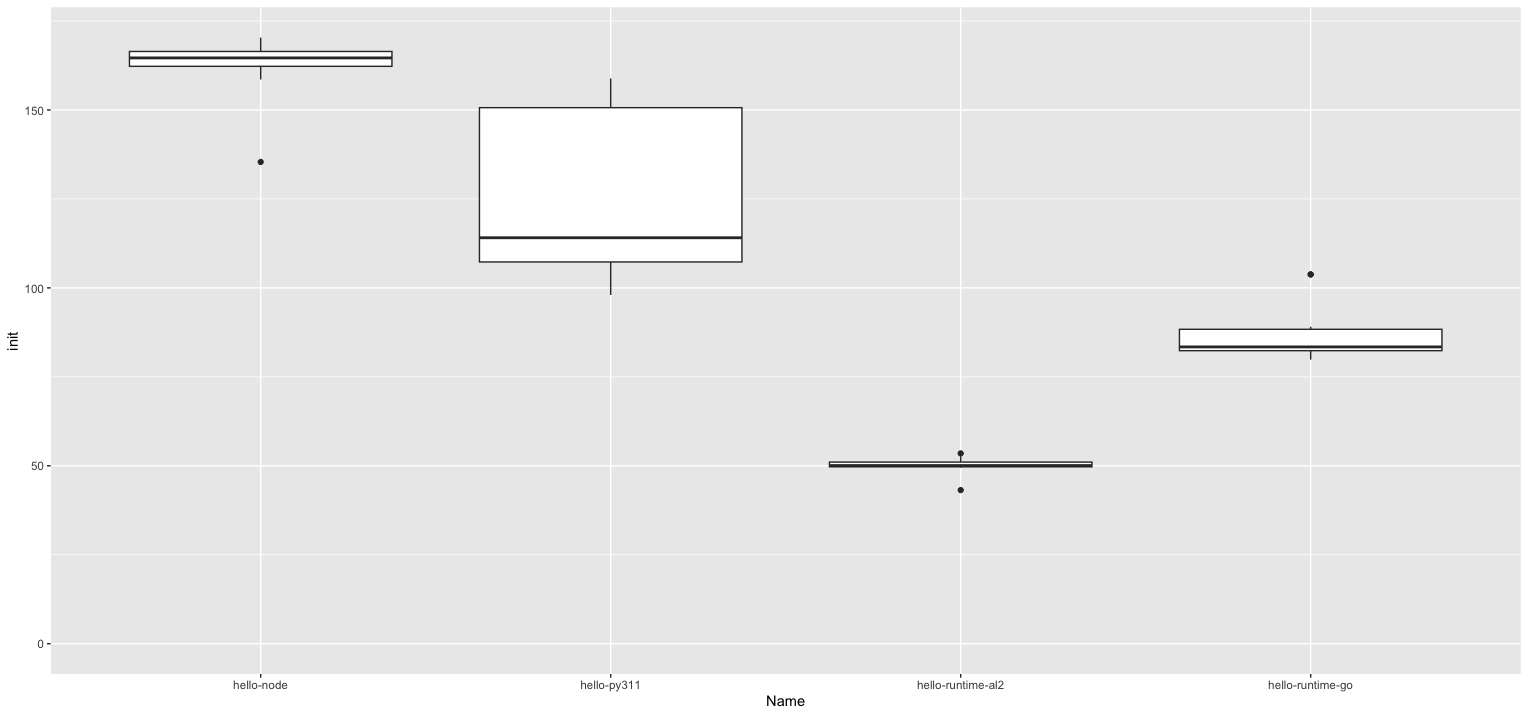
The AL2 runtime with GO hello-runtime-al2 is the fastest with a peak at 50ms. The second place is hello-runtime-go. A little bit slower, but with a large deviation Python 3.11 follows. The range with Python goes from 158 ms down to 98 ms for the init time.
And in the upper left we see Node.JS 18.x with a peak at 170ms. So more than three times slower than al2.
See raw data of the first plot.
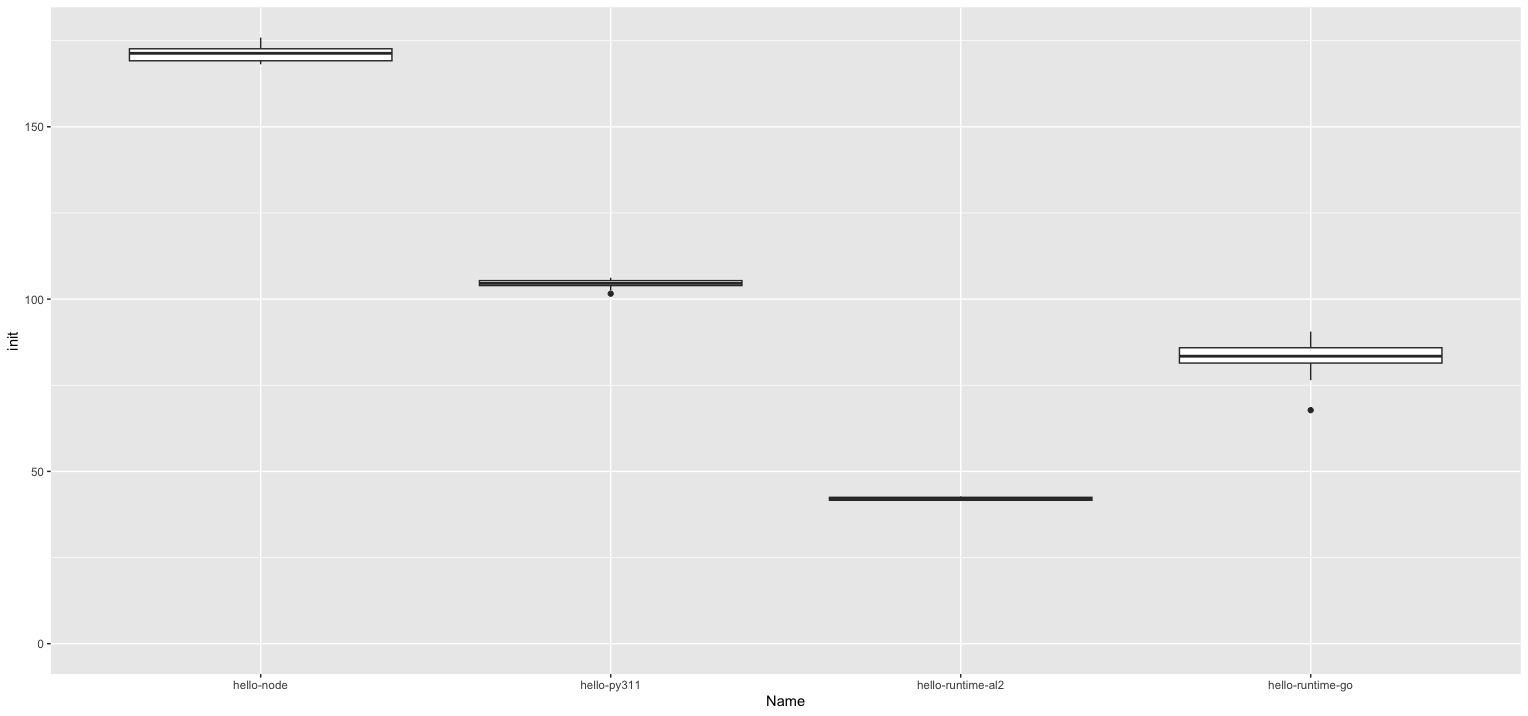
x86, 1024 MB
The 1024 MB plot is almost identical. That could be because according to the documentation: “At 1,769 MB, a function has the equivalent of one vCPU”. That could be interpreted as 128M and 1024M both only have one vcpu? See AWS Lambda Developer Guide.

See raw data of the second plot.
arm, 1024 MB
Now a 5..10% better performance for the init with arm processors. This is no surprise because the difference in CPU power shows itself with compute-heavy operations, so not a large effect now. An interesting behavior is Python on arm: the performance seems to be more stable in terms of standard deviation.
The “runtime-go” in this plot works with x86, because the GO1.x runtime only supports x86, unless you use container deployment.
But in term of pricing you get more power for less money. If you do not have any libraries which are only compiled for x86, then arm architecture gives you more power for less price. See AWS Lambda pricing for details.
arm, 2048 MB
In the end to check whether 2GB gives any advantage, a plot for this. Its identical with the 1GB plot.
Check in the console
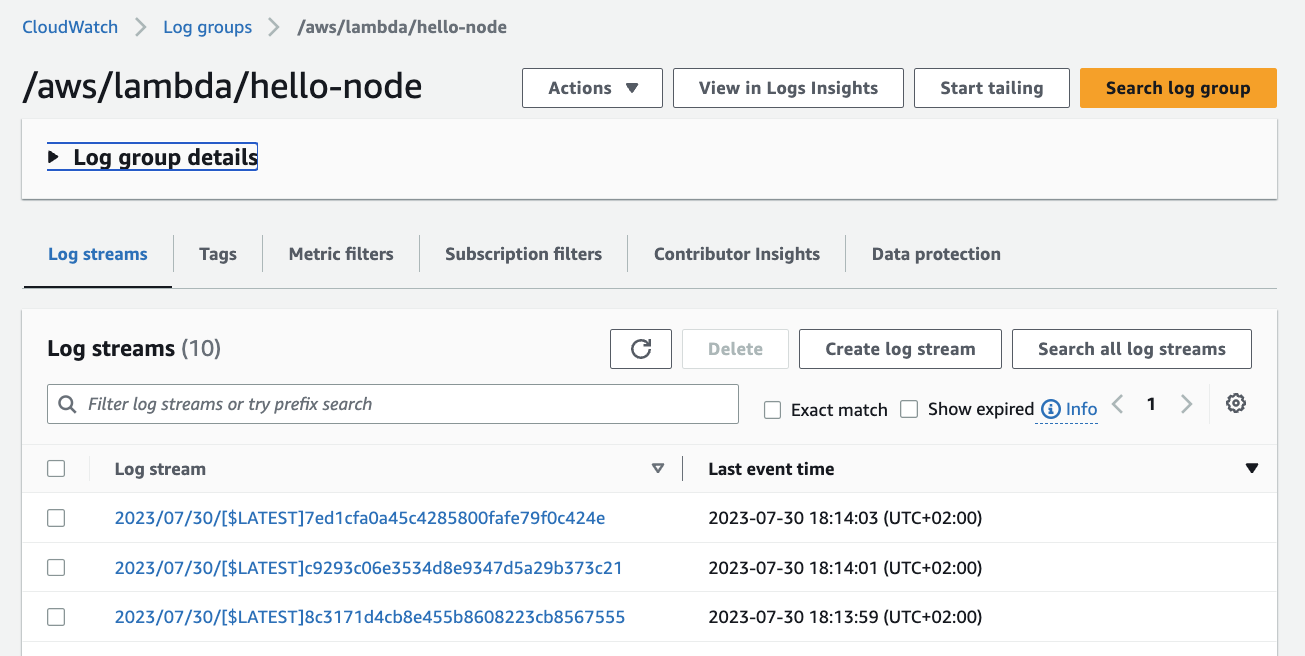
To check whether I made any errors, I double check the result with the console:
-
Yes, 10 entries from 10 invoke calls
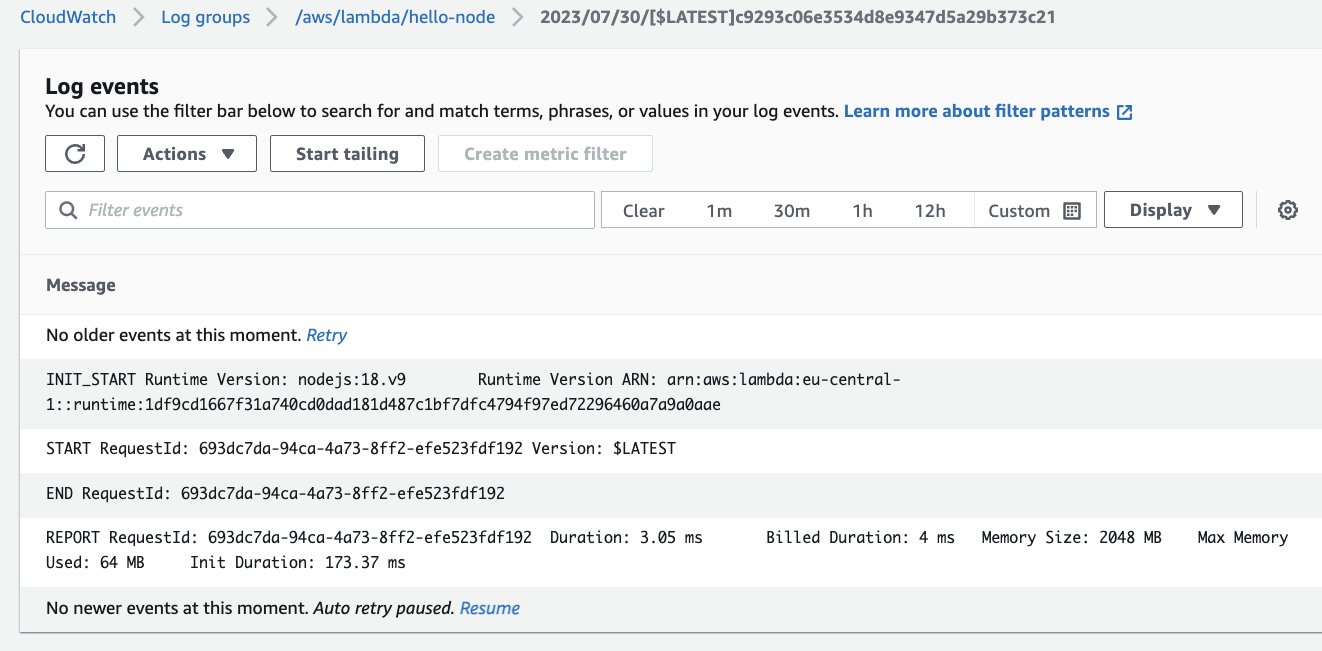
-
Yes, node is slow
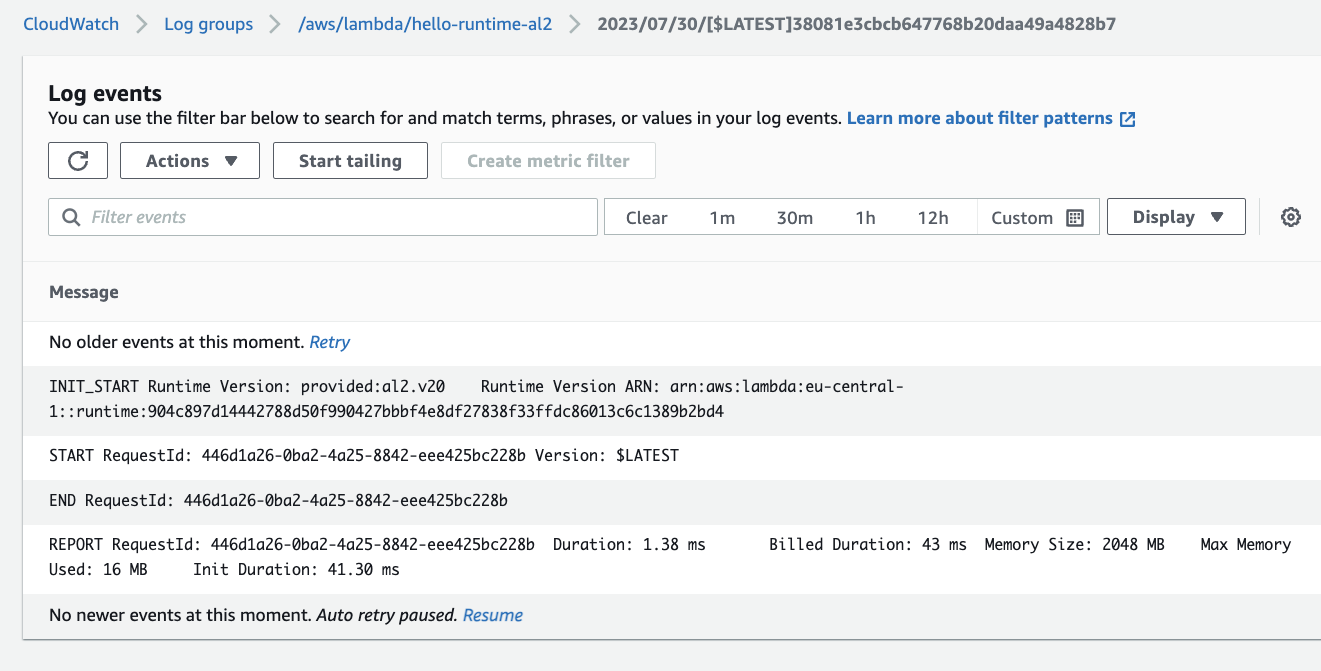
-
Yes, GO/AL2 is fast
Walkthrough
Create
Create functions you want to test, here node 18.x, Python3.11, GO1.x and custom runtime GO.
Call
Execute coldcalls.sh from github repository
for f in hello-node hello-py311 hello-runtime-al2 hello-runtime-go
do
     echo "Function:  $f ==============="
     ./dist/coldcalls --lambda $f --times 10 --memory "1024"
done
Function:  hello-node ===============
Cleared log events for log stream: 2023/07/29/[$LATEST]101f304ff77e47d196381611f7148eb1
Cleared log events for log stream: 2023/07/29/[$LATEST]26d3e725528048e885c4df59e8dd36b2
....
Cleared log events for log stream: 2023/07/29/[$LATEST]bf0d7f9fbb714e4fa70edb8dd1df7a44
All CloudWatch log entries for the Lambda function have been cleared.
2023/07/30 07:53:27 INFO Update memory=1024
2023/07/30 07:53:27 INFO Wait
2023/07/30 07:53:27 INFO Function is not active Status=InProgress
2023/07/30 07:53:29 INFO Function is active
2023/07/30 07:53:29 INFO Update Environment=0
See the source of coldcalls
Fetch
Execute collect.sh from github repository. Build the binaries for your machine first. You can do this with task build in the fetchreport directory.
FILE=speed.csv
echo "Name;Memory;Init;Cold;Billed" > $FILE
echo "Collect results ========================================="
for f in hello-node hello-py311 hello-runtime-al2 hello-runtime-go
do
    echo "Function:  $f ==============="
    ./dist/fetchreport --lambda $f >>$FILE
done
 ./collect.sh
Collect results =========================================
Function:  hello-node ===============
Function:  hello-py311 ===============
Function:  hello-runtime-al2 ===============
Report entries are written into speed.csv:
Name;Memory;Init;Cold;Billed
hello-node;2048;166.76;2.72;3
hello-node;2048;173.37;3.05;4
...
hello-py311;2048;106.95;1.34;2
hello-py311;2048;104.18;1.31;2
...
hello-runtime-al2;2048;41.3;1.38;43
hello-runtime-al2;2048;42.4;1.57;44
hello-runtime-al2;2048;41.51;1.15;43
See the source of fetchreport
Display
Then create graphics with the formidable R-Studio:
See:
Conclusion
The first time I read the announcement from AWS in Migrating AWS Lambda functions from the Go1.x runtime to the custom runtime on Amazon Linux 2 my question was: “Why?”
After doing these speed tests I know why. So whenever you need constant, small latency init duration and fast executions, GO is winning.
You can use these tools also for doing tests for different memory versions of your functions. Coldcalls takes lists!
/dist/coldcalls --lambda $f --times 10 --memory "128,1024,2048"
There is always new stuff for Lambda, so enjoy building!
If you need consulting for your serverless project, don’t hesitate to get in touch with the sponsor of this blog, tecRacer.
For more AWS development stuff, follow me on dev https://dev.to/megaproaktiv. Want to learn GO on AWS? GO here
See also
Thanks
Photo by Kelly : https://www.pexels.com/photo/black-motorcycle-on-road-2519370/