Build a scalable IDS and IPS solution using Suricata and AWS Gateway Load Balancer
In this blog post, I will demonstrate how to leverage Suricata with the AWS Gateway Load Balancer and Terraform to implement a highly available, scalable, and cost-effective IDS/IPS solution in AWS. This approach will enable you to monitor network traffic, detect threats, and block them before they reach your systems.
Introduction
When designing and implementing cloud architectures, prioritizing security is essential. Focusing on cloud security helps organizations mitigate the risks of data breaches, financial losses, and reputational damage. To strengthen cloud security posture, it’s crucial to use the right tools and applications in the appropriate places. Two critical tools for detecting and preventing malicious behavior are Intrusion Detection Systems (IDS) and Intrusion Prevention Systems (IPS). IDS and IPS continuously monitor your network to identify potential incidents, log information, stop threats, and report them to security administrators.
One versatile detection engine that functions as both an IDS and an IPS is Suricata. Developed by the Open Information Security Foundation (OISF), Suricata is an open-source tool used by organizations of all sizes. It is lightweight, cost-effective, and provides significant insights into network security. The effectiveness of IDS and IPS depends heavily on up-to-date signature databases, and Suricata benefits from an active community that maintains and expands its available signatures.
Architecture
To begin, let’s delve into the architecture we intend to deploy for this example. The diagram below provides a high-level overview of the setup we aim to simulate. Our primary objective is to build a highly available, scalable, and cost-effective IDS/IPS solution in AWS using Suricata and the AWS Gateway Load Balancer.
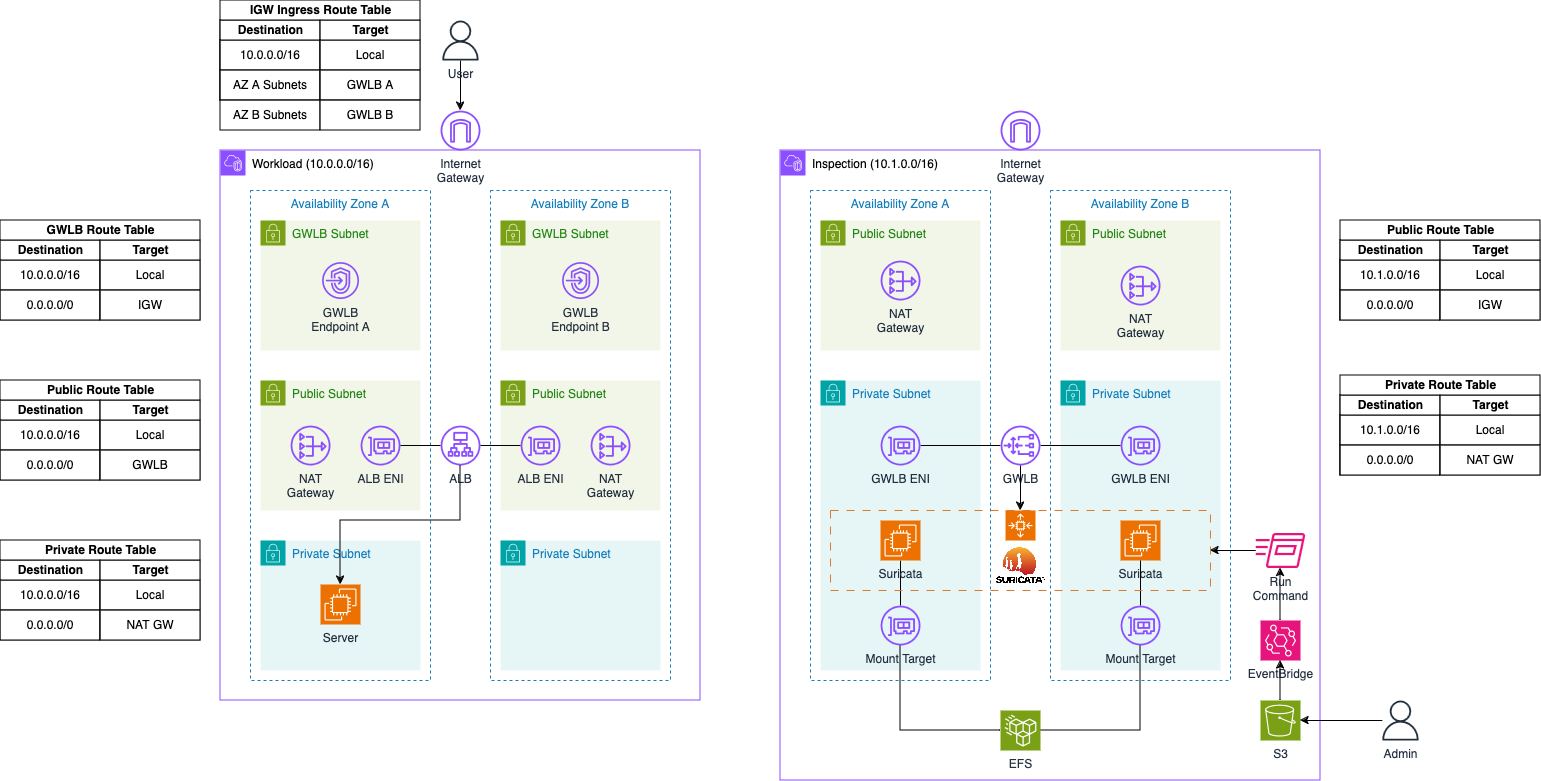
The architecture consists of two VPCs: the Workload VPC and the Inspection VPC. The Inspection VPC will house the Suricata appliance and the Gateway Load Balancer. This VPC is divided into two subnet categories: Public and Private subnets. Each public subnet will contain a NAT Gateway to provide Internet access, which is necessary for bootstrapping the Suricata instances and downloading the latest signatures from open-source databases. The Suricata appliance will be placed in an AWS Auto Scaling group to enable automatic scaling based on traffic load, allowing for the deployment of additional Suricata instances as needed. These instances will be attached to an Elastic File System (EFS) for durable and highly available storage of logs and important files.
Additionally, an S3 bucket and an AWS EventBridge rule will be implemented to manage custom Suricata rules post-launch. Rule files can be uploaded to the S3 bucket and weill be synchronized across all instances in the Auto Scaling group using Systems Manager Run Commands, triggered by EventBridge rules.
The Auto Scaling group sits behind an AWS Gateway Load Balancer, which distributes traffic to the instances within the group. The Gateway Load Balancer receives traffic through a Gateway Load Balancer Endpoint, with traffic between them encapsulated using GENEVE to ensure packets arrive unchanged at the appliance level.
In this setup, traffic originates from the Workload VPC, which is divided into three subnet categories: GLWB, Public, and Private subnets. The GLWB subnets contain the Gateway Load Balancer Endpoints connected to the Gateway Load Balancer in the Inspection VPC. When traffic arrives at the Internet Gateway of the Workload VPC, it is routed to the GLWB Endpoints via an Ingress Routing Table attached to the Internet Gateway. The public subnets house the NAT Gateway to facilitate Internet access from the private subnets and the Application Load Balancer, which receives user requests and forwards them to the servers located in the private subnets.
Traffic Flow
Ingress Traffic Flow
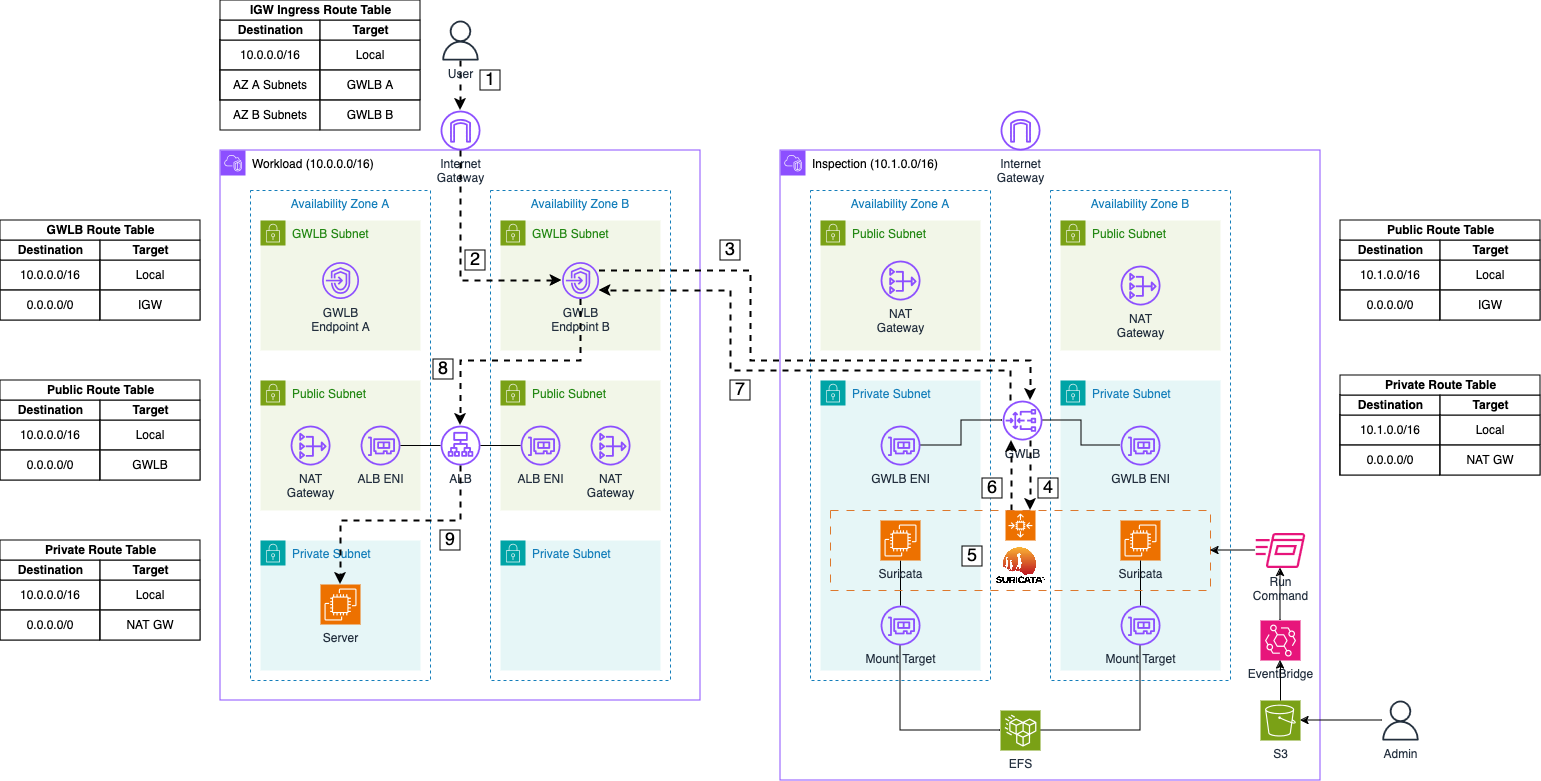
Now, let’s delve into the ingress traffic flow when using our Suricata setup with a Gateway Load Balancer.
-
Request: The user sends a request to the DNS name of our Application Load Balancer to access our web server. The request first reaches the Internet Gateway of our VPC.
-
Forward to GWLB Endpoint: The packet is routed to the appropriate Gateway Load Balancer (GWLB) Endpoint based on the entries in the Internet Gateway ingress routing table.
-
Forward to GWLB: The GWLB Endpoint receives the request, encapsulates the packet with GENEVE, and forwards it to the GWLB in the Inspection VPC.
-
Send to Appliance: The GWLB forwards the encapsulated packet to its target group, which includes the Suricata instances registered by the Auto Scaling Group.
-
Monitor Traffic: Once the packet arrives at a Suricata instance, the GENEVE protocol is temporarily stripped by Suricata, allowing the initial traffic to be monitored and logged using Suricata’s IDS and IPS capabilities.
-
Forward monitored Traffic: If the traffic is not blocked due to malicious activity, Suricata returns the GENEVE packet to the GWLB.
-
Return to GWLB Endpoint: The GWLB returns the inspected traffic to the Endpoint that initially sent the packet.
-
Forward to ALB: The GWLB Endpoint receives the inspected traffic and forwards it based on the subnet’s routing table. In this case, the packet is addressed to the private IP of the Application Load Balancer.
-
Forward to Server: The Application Load Balancer receives the initial request and forwards it to the web server.
Egress Traffic Flow
After describing the ingress traffic flow, let’s examine the egress traffic flow.

-
Response: After processing the user’s request, the web server sends a response back to the user. This response first goes to the Application Load Balancer (ALB).
-
Forward to GWLB Endpoint: The ALB routes the packet to the appropriate Gateway Load Balancer (GWLB) Endpoint based on the routing table entries of the public subnets where the ALB is located.
-
Forward to GWLB: The GWLB Endpoint receives the packet, encapsulates it with GENEVE, and forwards it to the GWLB in the Inspection VPC.
-
Send to Appliance: The GWLB then forwards the encapsulated packet to its target group, which includes the Suricata instances managed by the Auto Scaling Group.
-
Monitor Traffic: Upon arrival at a Suricata instance, the GENEVE protocol is temporarily stripped, allowing Suricata to monitor and log the traffic using its IDS and IPS capabilities.
-
Forward monitored Traffic: If the traffic is not blocked due to malicious activity, Suricata re-encapsulates the packet with GENEVE and returns it to the GWLB.
-
Return to GWLB Endpoint: The GWLB sends the inspected traffic back to the Endpoint that originally forwarded the packet.
-
Forward to Internet Gateway: The GWLB Endpoint receives the inspected traffic and forwards it to the Internet Gateway of the VPC.
-
Return to User: The response is then delivered to the user.
Bootstrap Environment
The code associated with this blog post is hosted on GitHub. Feel free to clone the repository or manually copy the code to your local machine. Within the provided directory, you’ll find two folders: inspection and workload. The inspection folder contains the complete Terraform configuration for the Suricata IDS/IPS setup in the Inspection VPC, while the workload folder contains the setup for the web server.
Before deploying our pipeline, you need to adjust a Terraform variable. Navigate to the inspection folder and open the terraform.tfvars file. You’ll find the following variable:
allowed_service_principal_arns = ["arn:aws:iam::xxxxxxxxxx:root"]
This variable defines which accounts are allowed to access the Gateway Load Balancer via Gateway Load Balancer Endpoints and AWS PrivateLink. Enter your AWS Account ID for the Workload to enable the connection between the two VPCs via the VPC Endpoints.
Please be aware that the attribute force_destroy has been set on all S3 Buckets for easier deletion of the infrastructure. It is advised to remove this attribute if the infrastructure is used as part of a production workload.
After making these adjustments, navigate to the inspection folder and run terraform init to initialize the Terraform providers, followed by terraform apply to deploy the Suricata infrastructure.
Once the Suricata infrastructure is deployed, go to the workload folder and repeat the commands terraform init and terraform apply to deploy the web server infrastructure.
Test Suricata Appliances
Once the infrastructure has been successfully deployed, you can start by uploading your custom Suricata rules. Access the AWS Console and navigate to the S3 service. Look for an S3 bucket prefixed with gwlb-firewall-ips-inspection and open it.
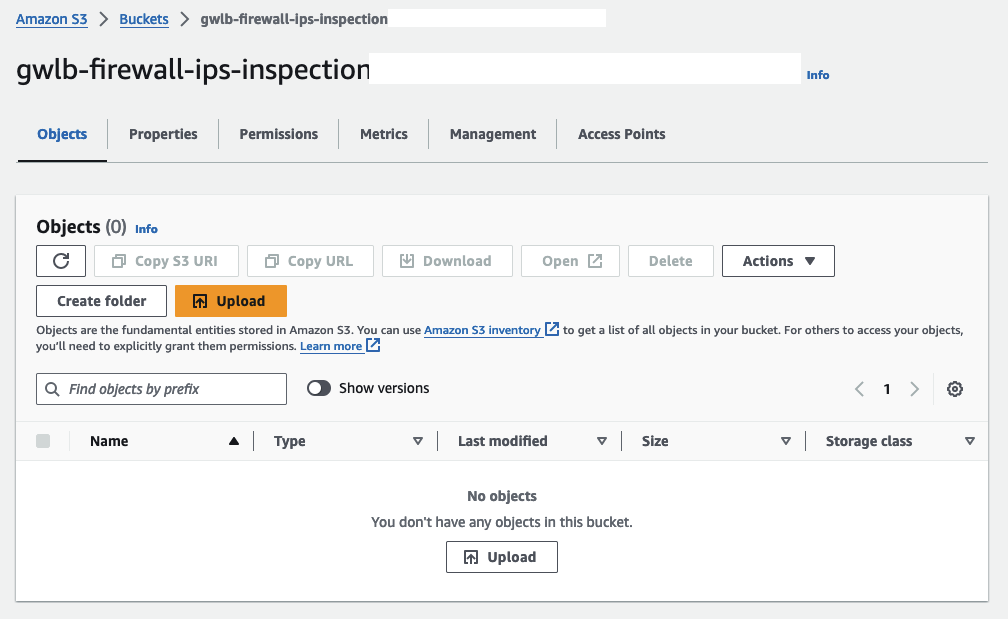
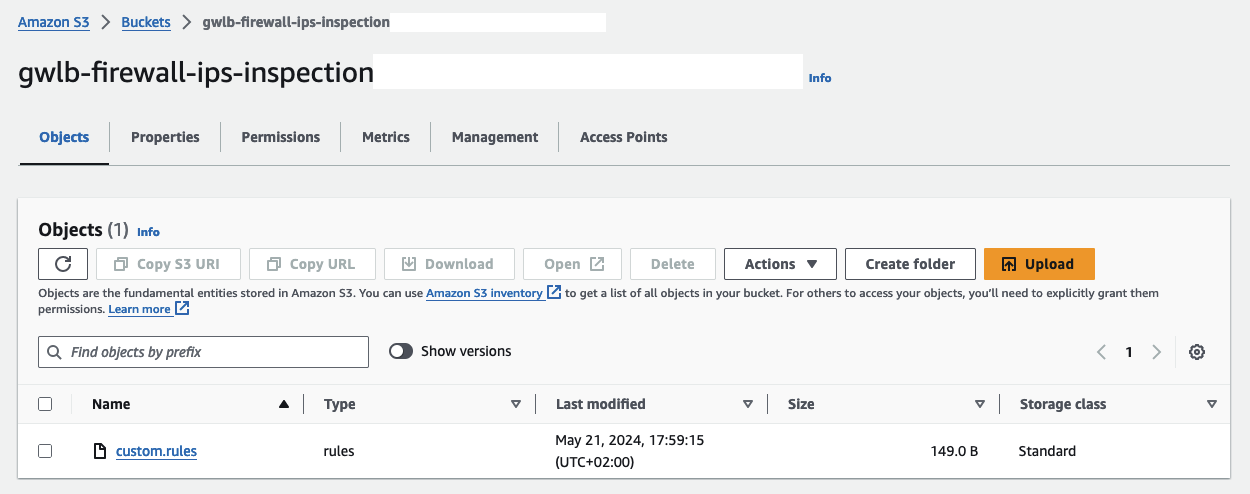
Upload a custom rule file named custom.rules located in the inspection/config folder. This file contains two rules that will trigger alerts for HTTP and ICMP traffic passing through the Suricata Appliance:
alert http any any -> any any (msg:"HTTP request received"; sid:1; rev:1;)
alert icmp any any -> any any (msg:"ICMP request received"; sid:2; rev:1;)
Do not change the name of the custom.rules file. The name is specified in the Launch Template User Data script of our EC2 instances.
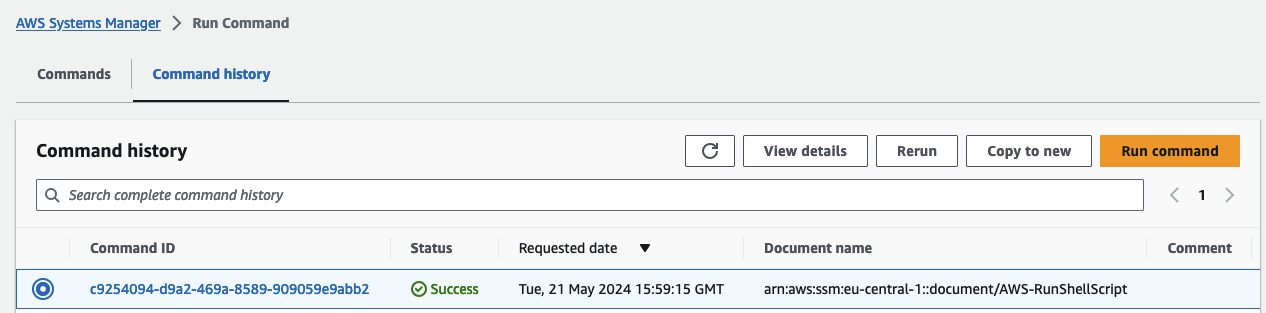
Uploading this rule file triggers an EventBridge rule, which executes a Run Command document. This document copies the rule file to all instances in the Autoscaling Group and reloads the Suricata rulesets. The newly uploaded custom rules will then be active.
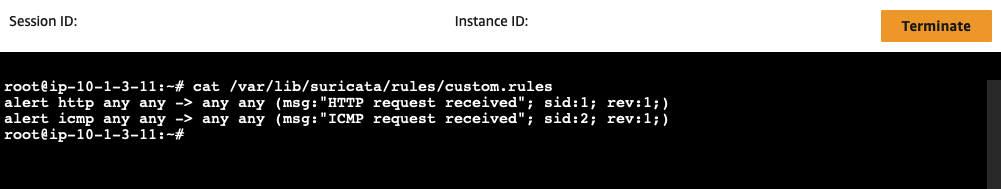
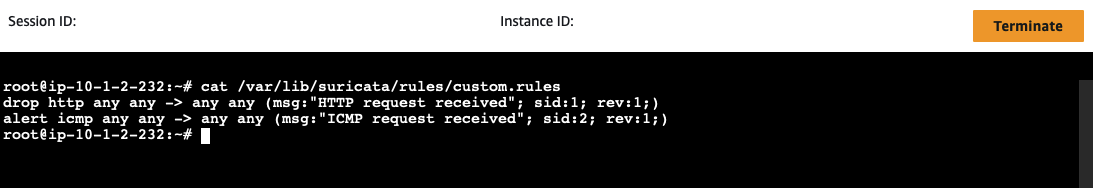
To verify the upload, access a Suricata instance using Systems Manager Session Manager. Open the AWS EC2 Console, select the suricata EC2 instance, click Connect, select the Session Manager tab, and click Connect. Once connected, run the following command:
cat /var/lib/suricata/rules/custom.rules
You should see the rules displayed in the terminal.
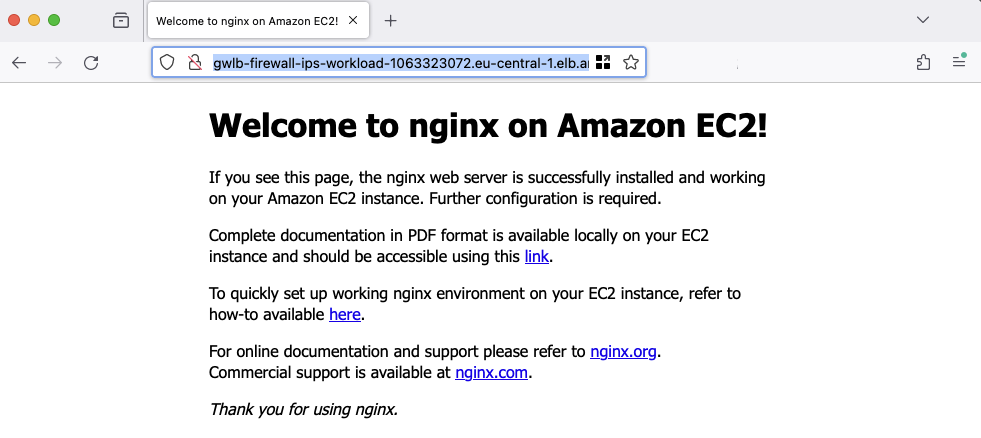
Next, access the web server using the Application Load Balancer Domain. Retrieve the DNS name via the Terraform output alb_dns_name created during the workload infrastructure deployment. A standard NGINX page should be displayed.
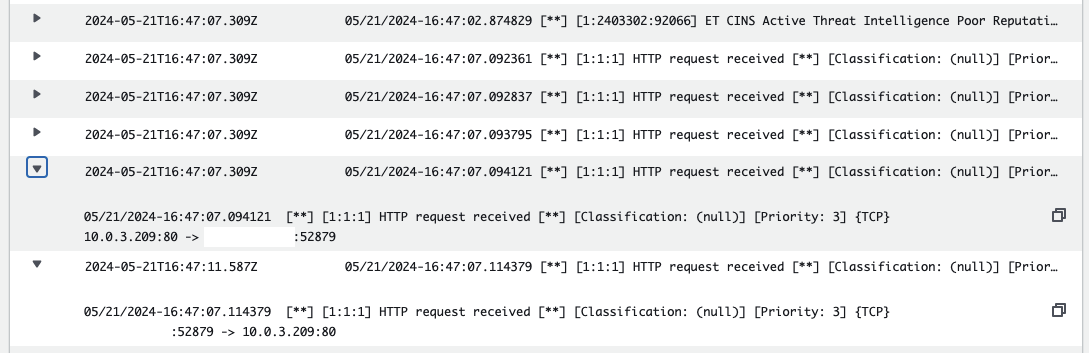
As part of the Suricata setup, multiple CloudWatch Log Groups are created to capture Suricata output. Navigate to the CloudWatch Console and open the log group /suricata/fast.log. You will find log streams named after the instance IDs of the EC2 instances that generated the output. Each instance creates its own log stream, allowing for detailed log analysis.
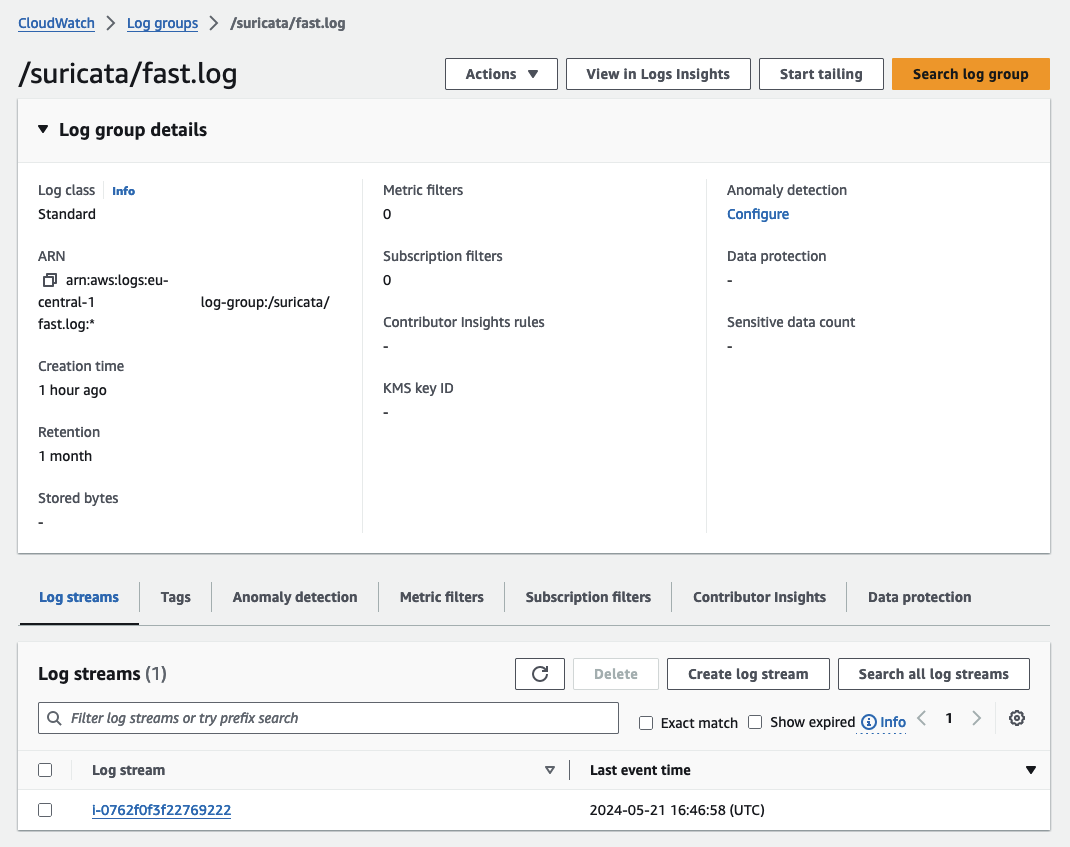
Open a log stream and review the entries. You should find log entries corresponding to the custom rules you created, as well as entries from the Suricata managed rules.
Adjust Suricata Ruleset
Now that we have verified our Suricata setup is working correctly, we will adjust our custom rules to block HTTP and ICMP traffic from reaching our web server. Open the file inspection/config/custom.rules and change the keyword alert to drop.
drop http any any -> any any (msg:"HTTP request received"; sid:1; rev:1;)
drop icmp any any -> any any (msg:"ICMP request received"; sid:2; rev:1;)
Upload the modified custom.rules file to the S3 bucket, overwriting the old version. This upload will trigger the EventBridge rule and the Run Command. Verify that the modification was successfully transferred to the Suricata instance by running:
cat /var/lib/suricata/rules/custom.rules
You should see the adjusted rules.
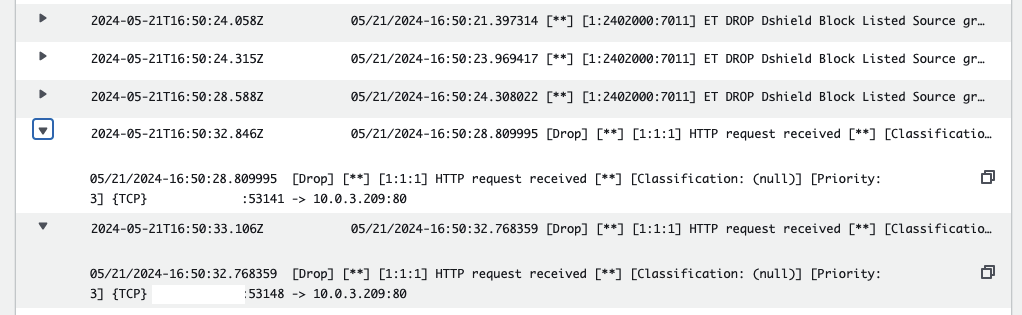
Refresh your browser. The connection to the web server should time out after a while. To confirm that Suricata is blocking your web requests, refresh the fast.log log stream in CloudWatch. You should see entries indicating that your requests are being blocked.
Congratulations! You have successfully implemented an IDS and IPS system using Suricata and AWS Gateway Load Balancer.
Summary
The architecture we’ve implemented serves as a foundational example, open to optimization for enhanced robustness and efficiency. Here are a few potential enhancements:
-
Transition to HTTPS: Transitioning from HTTP to HTTPS on the Application Load Balancer (ALB) would significantly enhance security by encrypting traffic.
-
Scheduled Rule Updates: Implementing scheduled actions to update managed rules would ensure that your IDS/IPS signatures are regularly updated, improving security.
-
Golden AMI Creation: Instead of configuring everything using user data in the launch template, creating a Golden AMI for the Suricata instance would streamline deployments and ensure consistency. For a detailed implementation, you can refer to my blog post on building Golden AMIs with Packer and AWS CodePipeline.
-
CI/CD for Custom Rules: Enhancing the process of adding and updating custom rules via CI/CD pipelines would provide a more robust and automated approach compared to the simple S3 upload method.
I hope you enjoyed this example and learned something new. I look forward to your feedback and questions. For the complete example code, please visit my Github.
— Hendrik
Title Photo by Frank Mckenna on Unsplash