Getting Started with QuickSight Analyses
In this blog post we will see how to get started with designing interactive analyses with Amazon QuickSight.
Preparation steps
Before we get to the main topic, let’s quickly create a dataset that we’ll use in our analysis.
Get the titanic.csv file: Right click on the following and save the link / link target as titanic.csv Github/titanic.csv
To create our analysis we need a dataset. Let’s quickly create a titanic dataset.
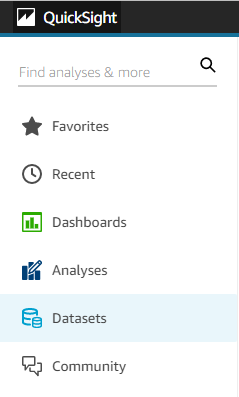
Open the QuickSight console and click on the Datasets button on the left side of the screen.
 Select
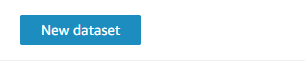
 New dataset in the new window.
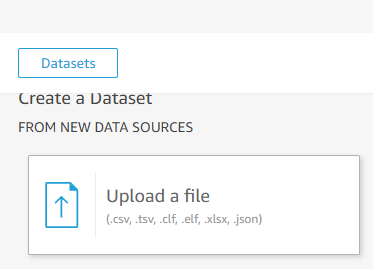
 As we are using a file to build our dataset, select
 Upload a file as the data source.
 In the file explorer choose the
 titanic.csv file you previously downloaded.
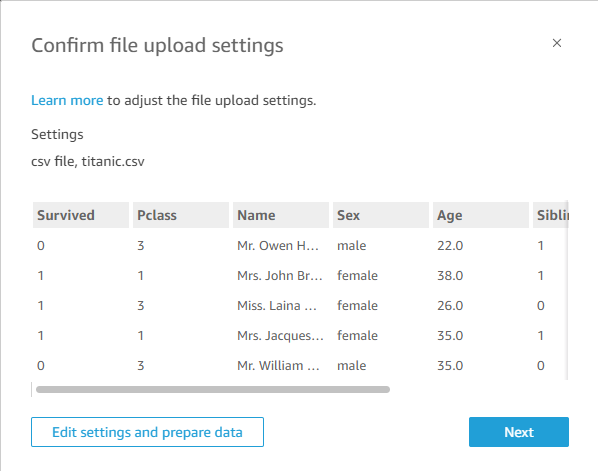
After uploading the file you should see a preview of the file content. Click on Next.
The dataset is now available in QuickSight. Click on Visualize to create an analysis using the Dataset. Note that it is possible to get back to the QuickSight main page, add a new analysis and add the dataset.

Goal
Through this tutorial, we will first see how to add a visual into a QuickSight analysis. Later on we will see how to add parameters, then briefly discuss calculated field. Following this, we will have a look at how to interactively change parameter values using controls and how to filter the data displayed on visuals.
Visuals
A visual is a graphical representation of your data.
Using the Add button in the top left corner you are able to add a visual, a calculated field, a parameter and other items.
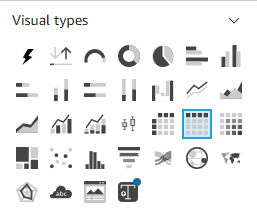
Select Add visual to add a new visual to your analysis.

Alternatively, you can add a new visual by clicking on an empty cell in your sheet and selecting a field. This will add an AutoGraph which is a meta visual that will try to change itself into the optimal visual type based on the fields you will connect to it.
From the list of available visual types select Table to convert the previously added AutoGraph into a table.
Let’s populate the table with some fields. Start by selecting the visual to populate it. Upon selecting a visual, field wells will appear on top of the windows. Their number and types depend on the visual type.
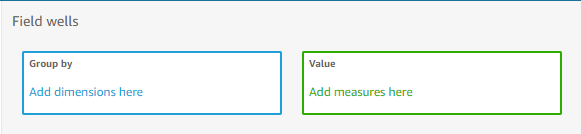 You can drag fields and drop them into wells.
Let’s populate the
You can drag fields and drop them into wells.
Let’s populate the Group by well with the fields:
- Name
- Sex
- Pclass
- Age
and the Value well with the fields:
- Fare (Sum)
- Parents/Children Aboard (Sum)
- Siblings/Spouses Aboard (Sum)
When adding values into most fields, available operations will change depending on the data type of the field. As we only added numeric data to the Value field, the default operation for this data type (Sum) was selected.
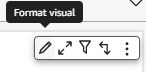
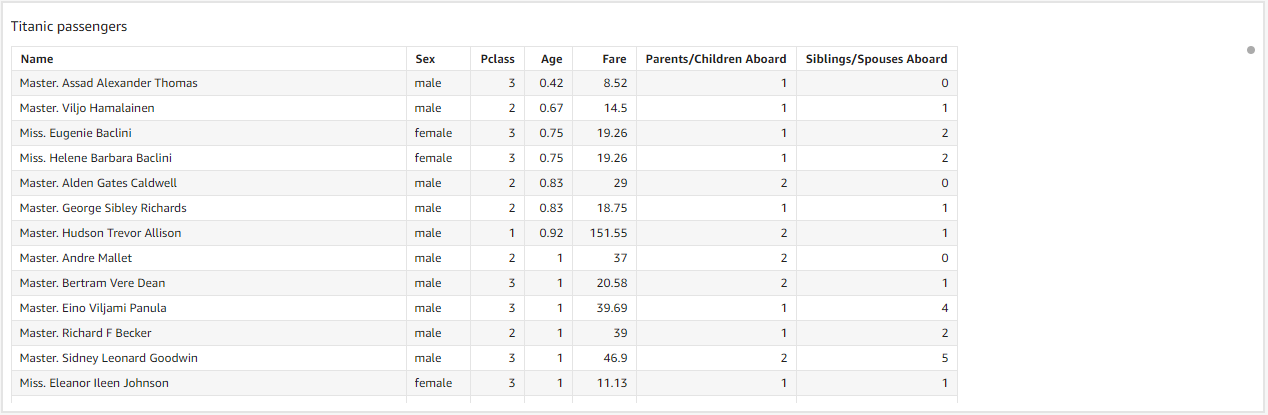
Let’s add a title to our visual. To change the title of a visual or to generally format it, you have to select it and select Format visual.
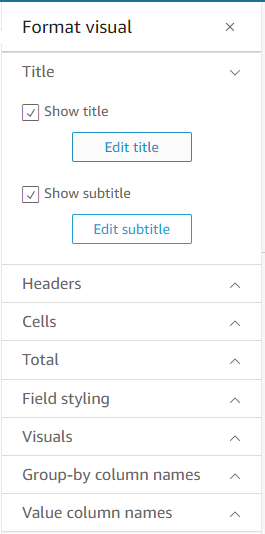 change the visual title to
 Titanic passengers.
Your visual should now look as follows.
Parameters
QuickSight Parameters are named variables. They can be used to change the state of calculated fields, controls or filters or visuals. It is possible to set default values to parameters.
To be able to search for persons based on their name in our analysis, we need a string parameter.
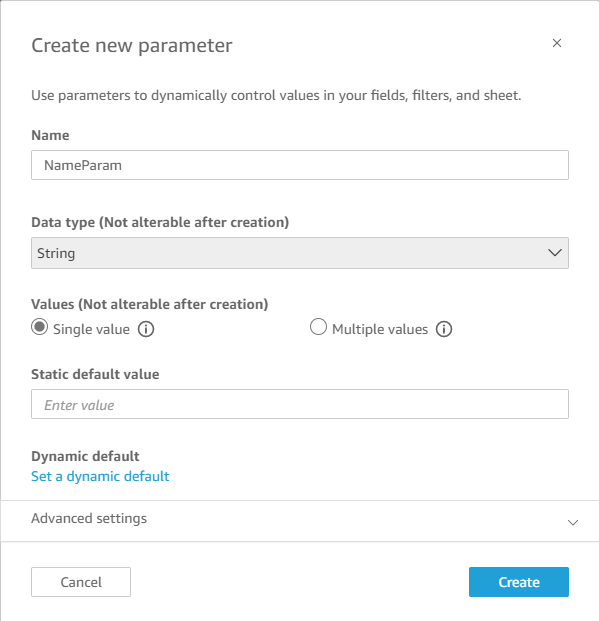
Click on the main Add button and select Add parameter to open the parameter.
Let’s add the parameter NameParam of type string that will later make it possible to filter passengers based on a given name.
We also want to be able to filter passengers based on their passenger class.
As we previously did for the name, we add a new parameter PclassParam of type Integer.

Calculated fields
Calculated fields are used to enrich your dataset with new fields based on data transformation or aggregation. QuickSight provides Operators and Functions to help you achieve that goal.
You may want to build a column age that will contain customer age at given any date the user would enter.
The column Survived contains a number that represents whether or not a passenger survived. We’ll add a calculated field to have the text representation of that information.
Add a calculated field named Survived text with the following content.
switch(
    Survived,
    0, "didn't survived",
    1, "survived",
    "UNKOWN"
)
Now let’s add another calculated field that will let us know how many direct relatives a given passenger has. Add a calculated field named Direct relatives with the following content.
{Siblings/Spouses Aboard} + {Parents/Children Aboard}
Let’s add our new calculated fields to our visual.
Select the visual and add the field Survived text into the Group by well, and the field Direct relatives into the Value well.
Controls
Controls are used in QuickSight to change the value of a parameter.
To add a Control, open the Parameters tab on the left and open the context menu of the parameter for which you want to add a control.
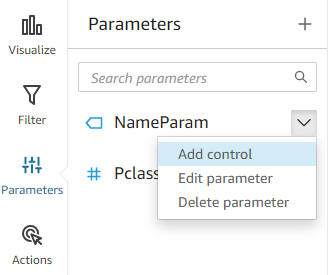
Let’s add a control for each of our parameters.
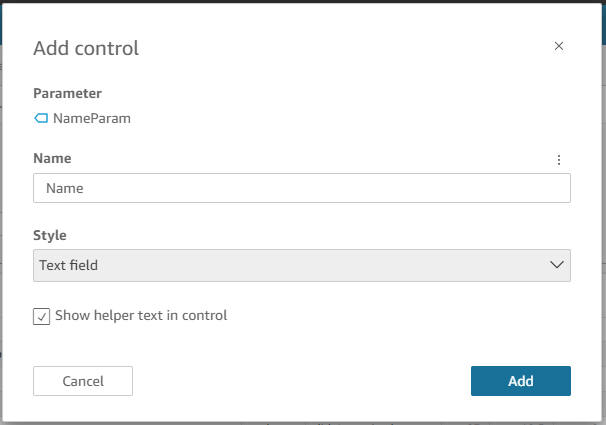
The parameter Name is of type String and we want its control to be a free input search field, so we use a Text field.
Let’s now add a control for the parameter pclass. Pclass is of type Integer and is limited to a certain set of values. To handle this with a control, we can either explicitly list all possible values, or dynamically get those from a column in our dataset. Explicitly listing values guarantees that all those values remain selectable in the user interface regardless of whether or not they are available in the current dataset. However, this has the drawback that the analysis needs to be updated each time there is a change in the set of selectable values.
For our analysis we’ll dynamically load values from the dataset.
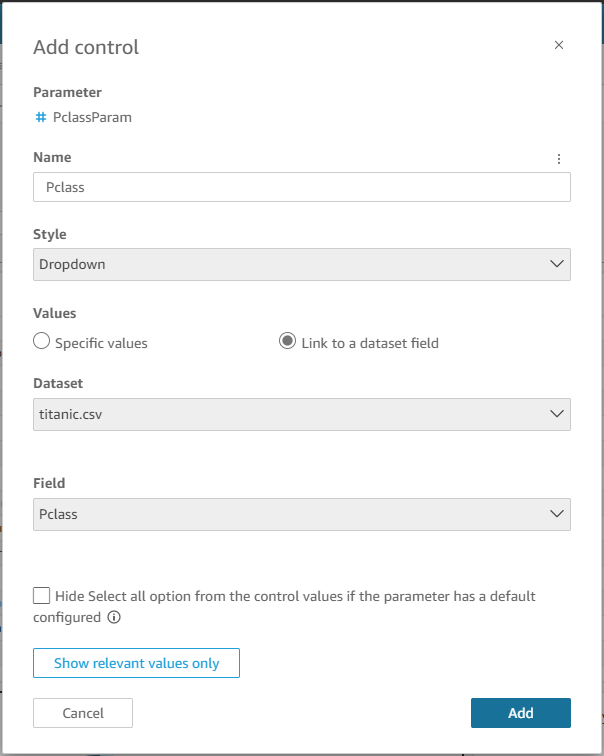
We set the control style to Dropdown and for the values we select the option Link to a dataset field. We then select our dataset titanic.csv and the corresponding field, Pclass and validate the control creation by clicking on Add.
Filters
Filters allow us to keep or exclude rows in our visuals based on the content of a given field.
To add a filter to a QuickSight analysis, select the visual on which you want the filter to apply, then open the Filter tab on the left of the screen.
Click on the ADD FILTER button and select the field on which you want the filter to be applied.
Let’s add a filter for the field Name
 Now that the filter is created, click on it again to edit it. We want the filter to work on all applicable visuals, so we choose the corresponding option.
When filtering string based columns, there are four filter types:
Now that the filter is created, click on it again to edit it. We want the filter to work on all applicable visuals, so we choose the corresponding option.
When filtering string based columns, there are four filter types:
Filter list: include/exclude items based on the fixed values available in the dataset.Custom filter list: include/exclude items based on a fixed list of values.Custom filter: include/exclude items based on a either a fixed value or a parameterTop and bottom filter: keep the top/bottomNitems based on the value of an aggregation function.
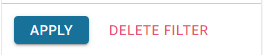
We’ll use a Custom filter and use the parameter NameParam to filter values. Select the corresponding values and click on APPLY.

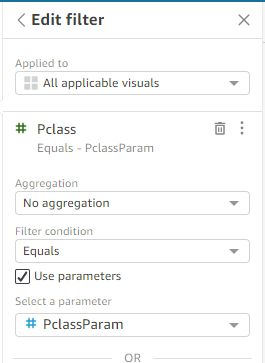
Now, add a new filter for the field Pclass and open it for edit.
We want this filter as well to be applied to all applicable visuals. Select the Aggregation mode No Aggregation and and the filter condition Equals. Finally, enable parameter usage and choose the parameter PclassParam. Click on APPLY to save the modifications.
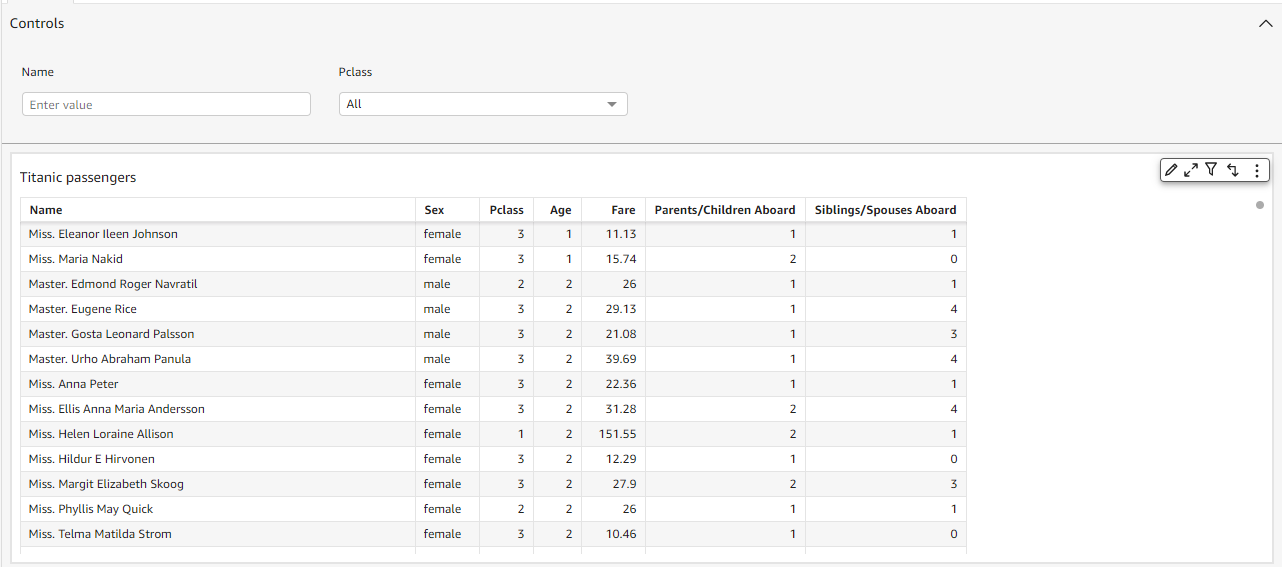
That’s it. Our table visual should now react to changes made on each control.
Summary
In this post we introduced QuickSight analyses and went through the necessary steps to add interactive visuals. We built the following visual.
 I hope you now feel equipped to start your QuickSight journey with Analyses.
Thanks to
Photo by Towfiqu barbhuiya on Unsplash