You can’t Opt-Out of Performance Tracking in the AWS Console
I’ve been using the AWS console with the Firefox Developer tools open recently for totally innocent reasons, and inspecting the Network Tab showed me a lot of activity, even though there was very little activity on my part at that time.
AWS uses some utilities for performance and usage monitoring in the AWS console. These vary a bit from service to service, but they periodically report information about your activity to AWS. If this sounds like CloudTrail, you’re not entirely wrong. CloudTrail captures AWS API calls for audit logging, something you, as the customer, are typically interested in.
The tracing is primarily for AWS’ benefit and allows engineers to figure out how the console is performing and what features you’re using. At least that’s the idea. You may indirectly benefit from improvements that come as a result of this analysis. What is AWS collecting though? We can use the browser’s developer tools to find that out. In my case, that means the Firefox dev tools.
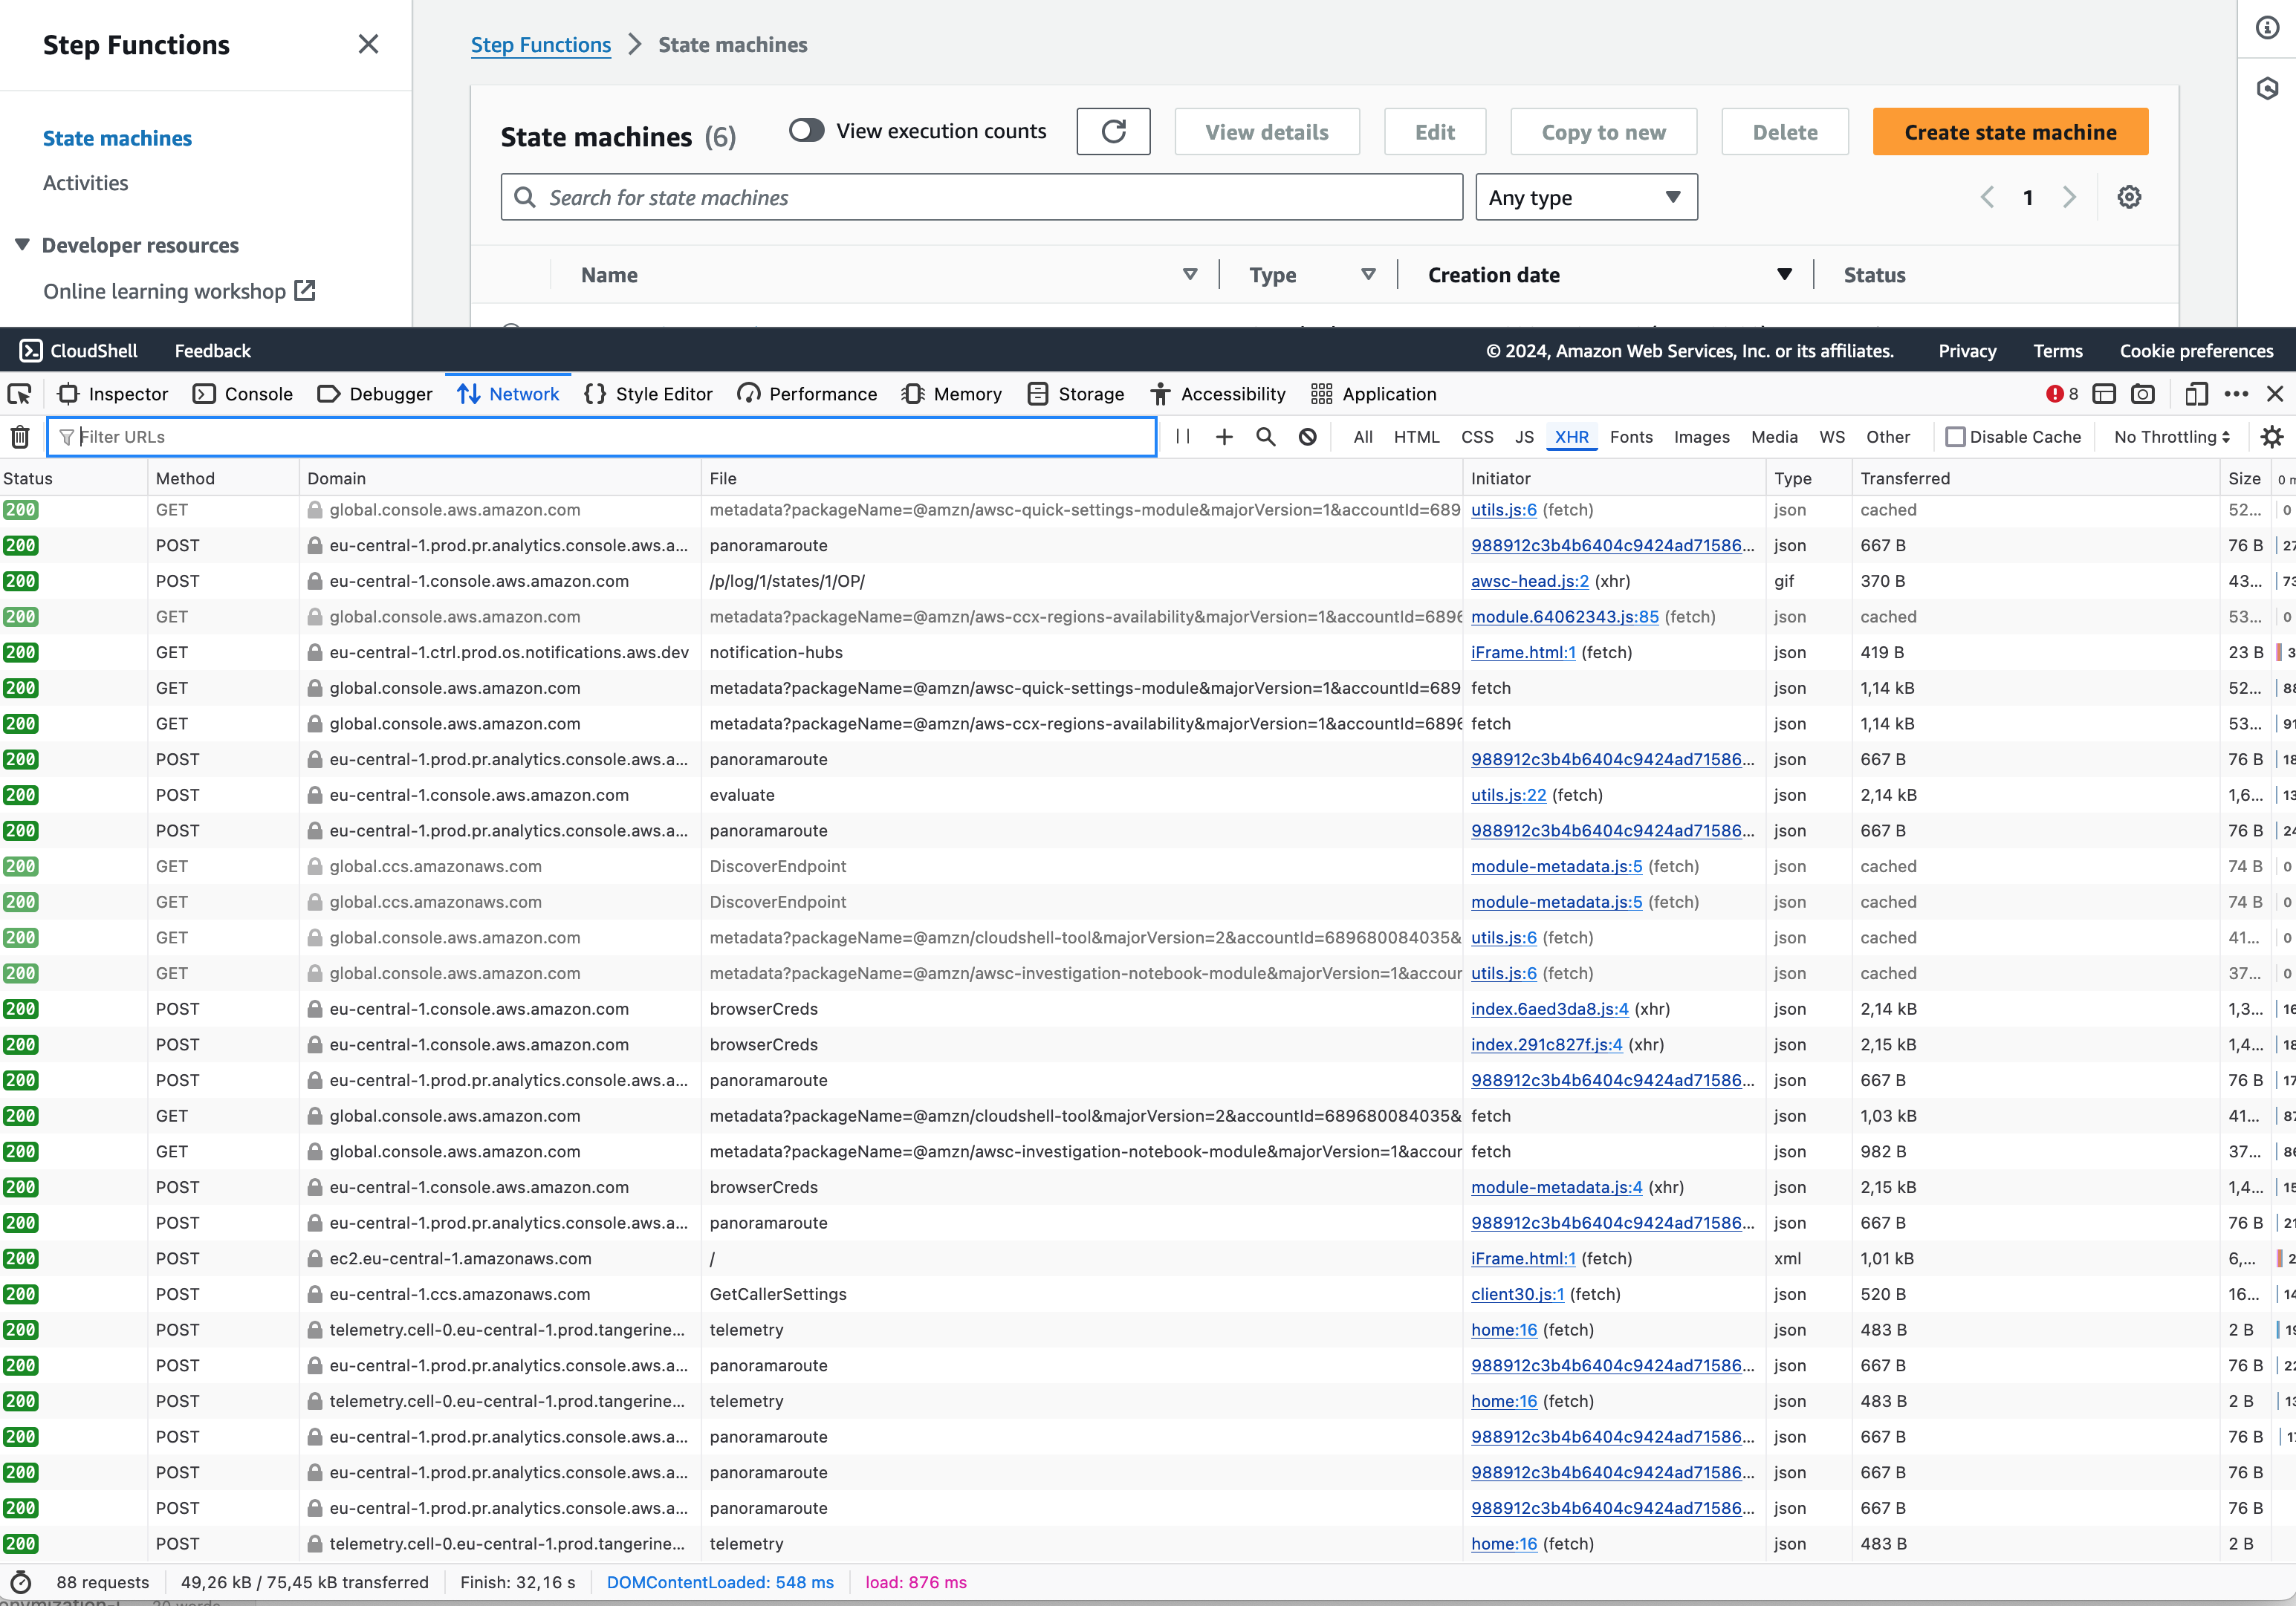
As my first target I chose the Stepfunctions overview page, opened the dev tools, cleared the history and reloaded the page while selecting XHR requests in the filter. XHR requests are basically asynchronous requests to webservers that happen after the original page is downloaded, i.e., primarily Javascript code that makes requests to HTTPS endpoints.

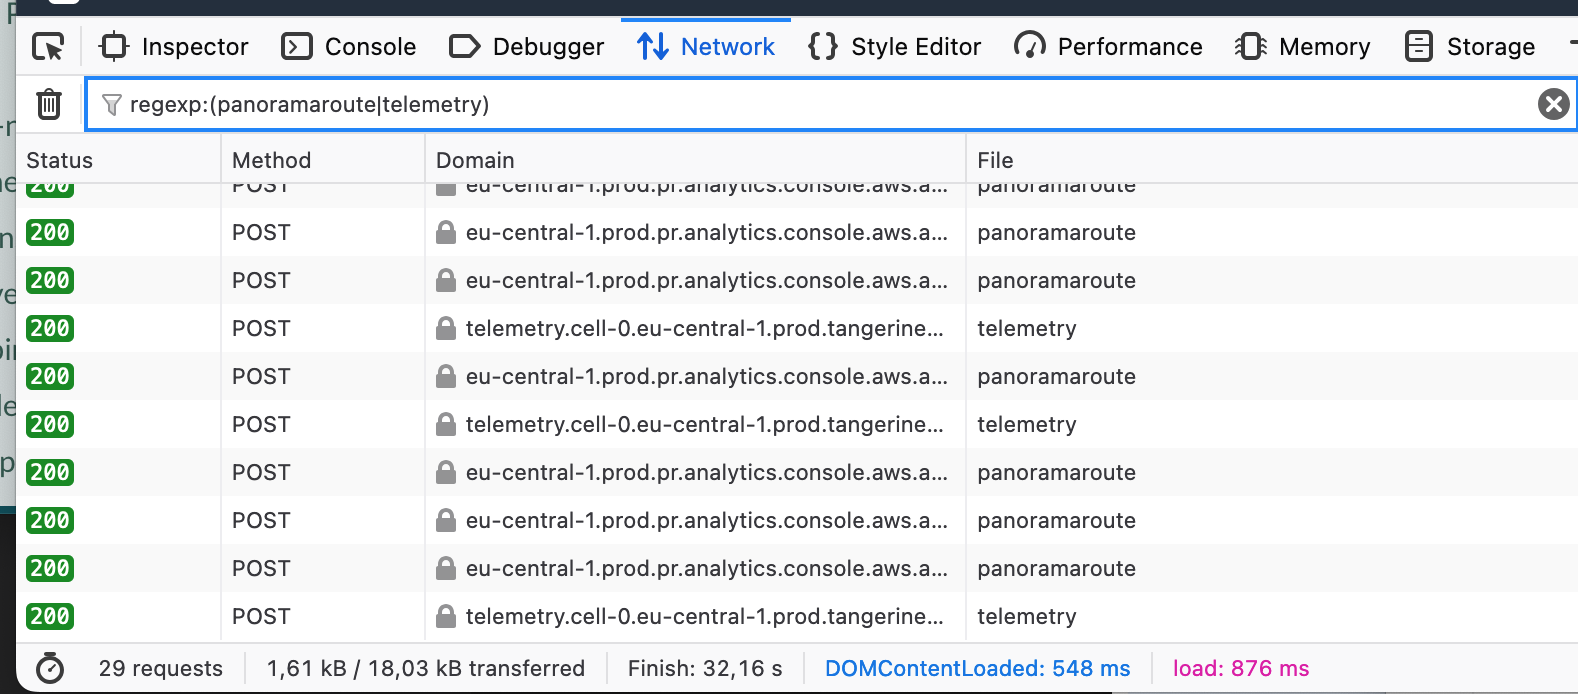
This may be a bit small, but the initial page load causes 88 requests (your mileage may vary), which is a lot for a view that only shows a list of step functions. If we only select analytics requests, we can see that 29 of those requests are the browser reporting some data to AWS. That’s almost a third of requests busy collecting data about our activities.

We could also frame this as AWS using your electricity to collect data about you. But what kind of data?
Panoramaroute
Let’s take a closer look at one of these requests to a /panoramaroute endpoint. Among others, these requests contain a batch of events that are sent to the backend, here’s one such event.
{
	"0": {
		"browserColorDepth": "30",
		"browserCookies": "",
		"browserLanguage": "en",
		"browserViewPortHeight": "759",
		"browserViewPortWidth": "1377",
		"consoleRegion": "eu-central-1",
		"deviceResolutionHeight": "1890",
		"deviceResolutionWidth": "3360",
		"deviceTimeZone": "-120",
		"domain": "Prod",
		"eventSource": "polaroid",
		"eventType": "performance",
		"modality": "web",
		"operationalData": {
			"metricList": [
				{
					"metricDetails": "{\"elementType\":\"BUTTON\",\"elementIdentifier\":\"84-1724305792678-8342\",\"elementText\":\"Aug 26, 2023, 10:14:14 (UTC+02:00)\"}",
					"metricName": "largestContentfulPaint",
					"metricUnit": "Milliseconds",
					"metricValue": 2821
				}
			]
		},
		"pageUrlPath": "https://eu-central-1.console.aws.amazon.com/states/home?region=eu-central-1#/statemachines",
		"referrer": "https://eu-central-1.console.aws.amazon.com/states/home?region=eu-central-1#",
		"requestId": "886e9092-ec00-4928-bea5-576a8a8069fb",
		"requestUri": "https://eu-central-1.console.aws.amazon.com/states/home?region=eu-central-1#/statemachines",
		"service": "states",
		"serviceConsolePage": "stateMachinesList",
		"serviceSubSection": "stateMachine",
		"tabId": "23982ae6-2306-4347-9d6b-a71f1d9b00d5",
		"timestamp": "1724305833070",
		"version": "2.8.159"
	}
}
We can see that there’s information about:
- my browser’s language (
browserLanguage) - the screen resolution (
deviceResolution*) - the browser window resolution (not quite - its viewport) (
browserViewPort) - the timezone that’s set on my device (
deviceTimeZone) - which previous site I came from (
referrer) - which AWS service I’m using and what I’m doing (
service*) - what level of color detail my screen supports (
browserColorDepthwiki) - and some metrics in the
metricListelements
If we combine this with the information that’s sent with the standard HTTP headers, such as User-Agent, AWS can get a pretty good understanding of how I’m using the AWS console. That’s not all it sends; it also includes the awsIdentityToken, awsUserInfo, and awsUserInfoSigned keys. The awsIdentityToken is a JSON web token (JWT) that encodes my ARN and username and is cryptographically signed. As far as I can tell, the values in the other two attributes contain the same information, once in “plain text” (URL-encoded) and once signed, as the attribute name indicates.
It seems that this information may be added for authentication purposes, as no other Authorization header or cookies are present on these requests. I really hope that this data is anonymized on the server side; it’s a bit creepy for AWS to spy on individual customers’ activities like that.
I can see how this metadata is useful for developers to figure out how most users are using the AWS console, and where (performance) problems may lie. I’d prefer to opt-in to such measures, though.
Telemetry
The other endpoint that receives data is a /telemetry endpoint on a region-specific domain. Here’s an example of part of the payload.
{
	"7": {
		"callerCategory": "customer",
		"content": {
			"eventSource": "unified-console",
			"eventTrackerConfig": {
				"logLevel": 4,
				"tangerineBoxTelemetry": {
					"token": "v1/b0823f13f989aec677b1eaf3224fd8b72b8fb2572d61c462643f94957bc8f9d1"
				}
			},
			"eventTrackerName": "cloudscape-global-features",
			"eventType": "log",
			"logLevel": 4,
			"payload": {
				"metricName": "awtLoadCount",
				"metricUnit": "Count",
				"metricValue": 1
			}
		},
		"location": "https://eu-central-1.console.aws.amazon.com/states/home?region=eu-central-1#/statemachines",
		"nav2Enabled": false,
		"page": "stateMachinesList",
		"requestId": "2bca7f735ceff85ead4eb03a08fe084d",
		"subSection": "stateMachine",
		"timestamp": "2024-08-22T06:20:52.866Z",
		"tokenRefs": [
			5
		],
		"type": "log",
		"version": "2.0.15591.0#147a69b9 (broker: 1.0.1478.0#9ca45f2a)"
	}
}
As you can see, this one doesn’t include any browser-identifying metadata. From looking at quite a few of these, it seems like it focuses on numerical metrics, i.e., latency measurements for backend calls, etc. This API call also includes the users’ JWT identity token - not as part of the payload this time - but as a bearer token in the Authorization header. Just looking at the request log, it seems like the telemetry endpoint is used less frequently than the panoramaroute one.
Why is this a problem?
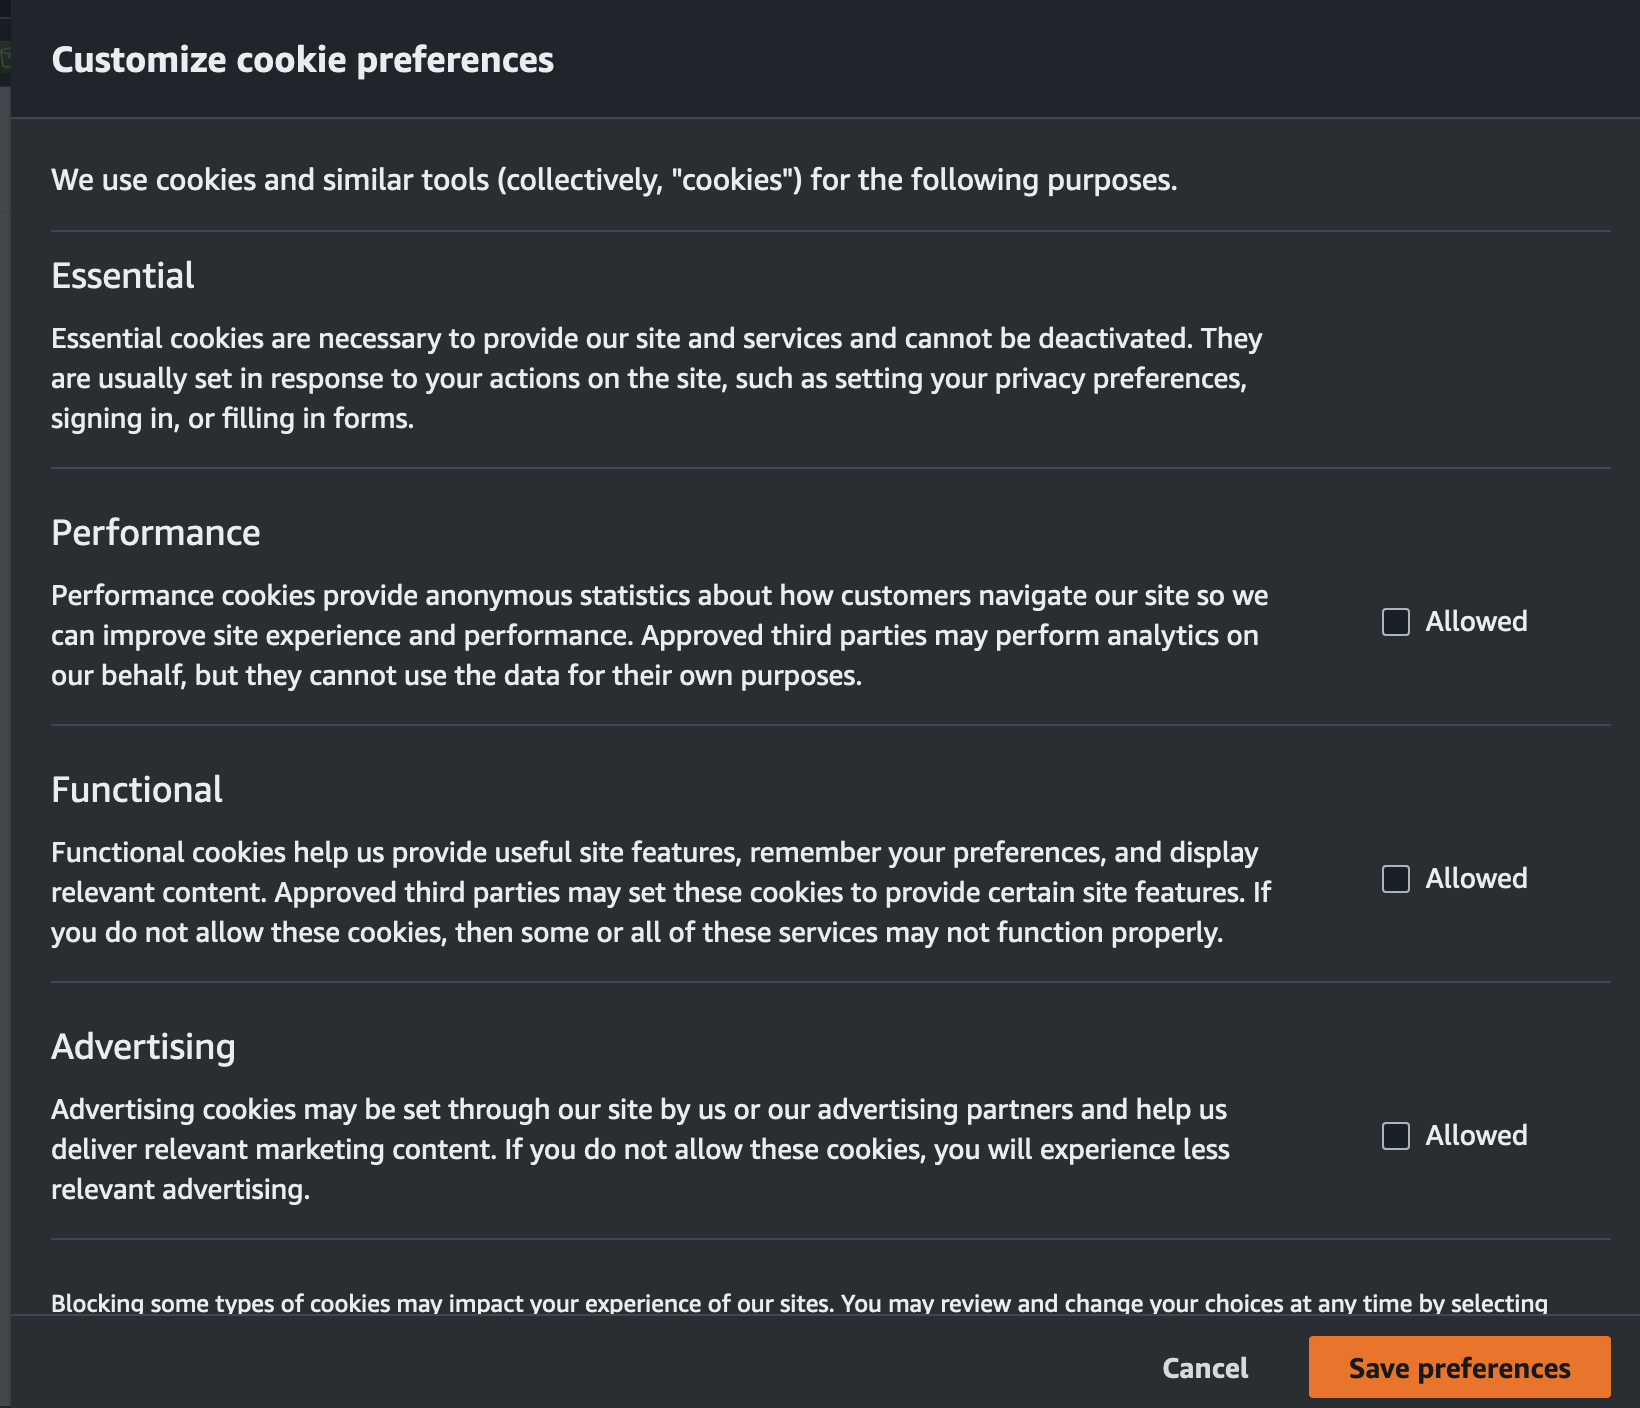
As I said, I can understand why developers would like to have this kind of information. I’m sure it can help optimize things, there’s just one problem. When you log in to the AWS console for the first time (try for example a Chrome Guest Session), you’re presented with the cookie banner we all know and love (right?). If you click on “Customize”, you’re presented with this menu.

By default, performance cookies are disabled here. Upon closing this with “Save preferences”, you can use the console as you see fit. This is the way I did it. I did not consent to performance measurement cookies. So, why is all this tracking with a performance measurement context going on?
Well, technically there are no cookies involved. Neither of the endpoints, that accepts data, sets or receives cookies. Technically correct - the best kind of correct.

Unless… the dialog talks about “cookies and similar tools”. I’d argue that using my JWT ID token to identify me to an AWS endpoint is a similar tool since this is essentially what (session) cookies are used for.
That’s not how you Earn Trust with customers, and I’d argue it’s giving Customer Obsession a new meaning.
What can AWS do about it?
Stop tracking console users without consent and respect their clearly communicated choices.
What can we do about it?
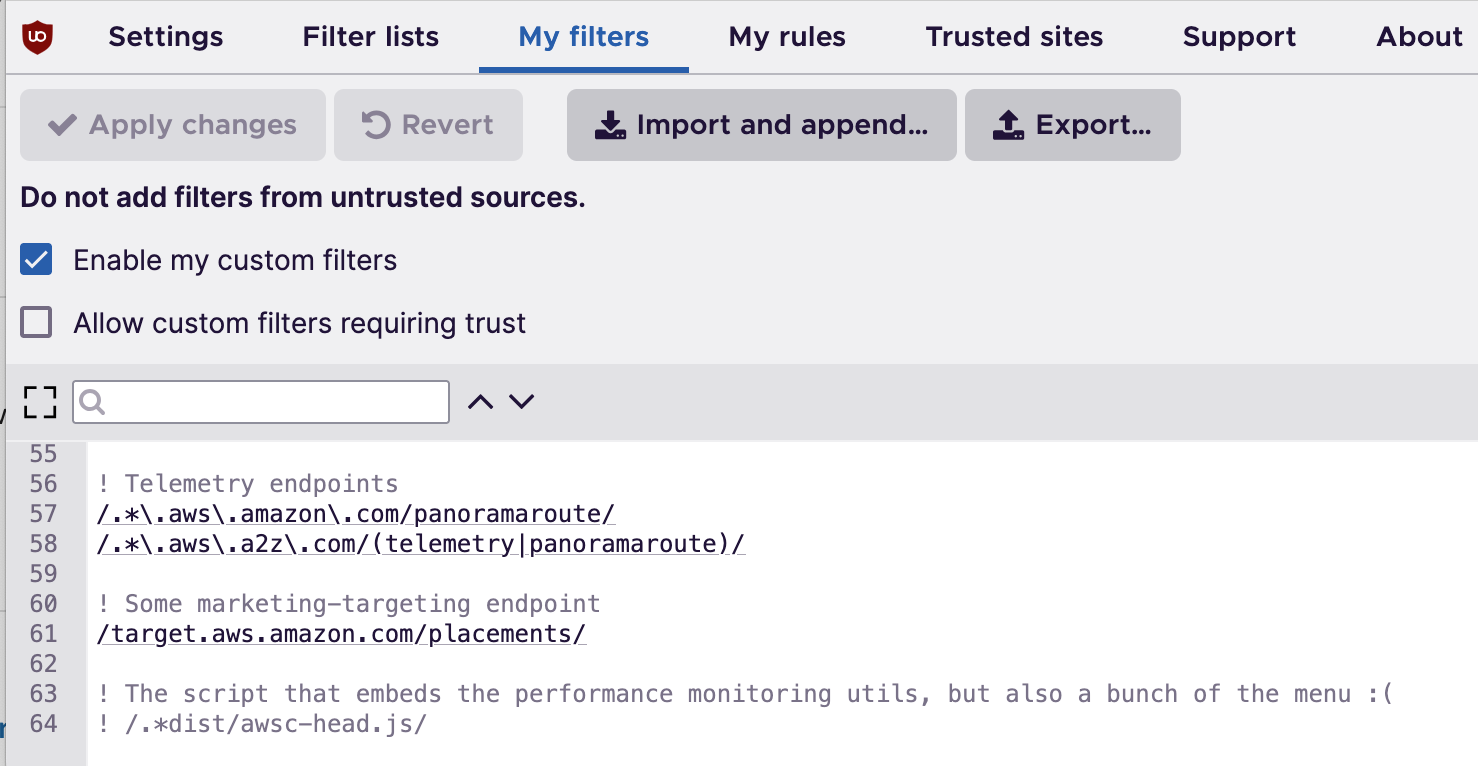
I use the browser extension uBlock Origin to get rid of a bunch of ads and privacy invading trackers. By default, it won’t block these telemetry calls, but you can extend the rule set by adding static filters in the settings. These are the additional filter rules I’ve added. Essentially, they block connections to the panoramaroute and telemetry endpoints.
! Telemetry endpoints
/.*\.aws\.amazon\.com/panoramaroute/
/.*\.aws\.a2z\.com/(telemetry|panoramaroute)/

! Some marketing/targeting endpoint
/target.aws.amazon.com/placements/
As a bonus, I’ve also added a rule to get rid of some marketing / targeting endpoint that I saw being contacted in the Lambda console. You can add these under “My filters” in your uBlock Origin settings.

It would be much nicer if we could just block the javascript that makes these calls, but the file that contains the code also delivers a huge part of the menu bar, so we can’t just block that. I’m sure there are more sophisticated ways of blocking this, but I just know Regex, and I hope AWS will fix this on their side.
Conclusion
At the time of writing this, AWS tracks your activities in the AWS console even though you made it clear that you don’t consent to this behavior. I hope this is just a bug that accidentally appeared in two independent places at the same time which AWS will fix soon.
Until that happens, you can block these requests yourself, but you really shouldn’t have to.
— Maurice
