Complexity costs: Read performance for nested DynamoDB items with different Lambda configurations
This content is more than 4 years old and the cloud moves fast so some information may be slightly out of date.
Introduction
DynamoDB allows us to store items with a size of up to 400 kilobytes. This grants us a lot of flexibility, but there is a trade off. Reading and writing large items comes at a cost. I’m not just talking about the read and write capacity units, although the required units are significant:
- Reading a single 400KB item with eventual consistency consumes 50 RCU (400 / 4 * 0.5)
- Reading a single 400KB item with strong consistency consumes 100 RCU (400 / 4)
- Writing a single 400KB item consumes 400 WCU (400 * 1)
Monetary costs in the form of RCUs/WCUs aren’t everything. In the real world speed is also important.
Some time ago I saw a question on stackoverflow where a user was asking about ways to optimize reading large items from DynamoDB using a Lambda function written in Python. They were complaining about read times upwards of a few seconds for roughly 400KB sized items. I was intrigued, because I always thought about DynamoDB and its API as really fast at any scale. I wanted to find out what went wrong and did some analyses.
Long story short: the Lambda function was configured with only 256MB of memory. This meant very little CPU performance and it just took a long time to process the DynamoDB response. I figured it out after remembering what I learned when I wrote the How boto3 impacts the cold start times of your Lambda functions post a few weeks ago.
After that experience I decided to figure out how long different Lambda functions take to read different item sizes more methodically and devised an experiment.
Experiment Setup
There are several factors that may impact the GetItem times:
- Memory allocated to Lambda function
- Size of the item in DynamoDB
- Kind of item in DynamoDB: deeply nested or flat structure
- Abstraction level in the SDK, i.e. the
clientorresourceAPI.
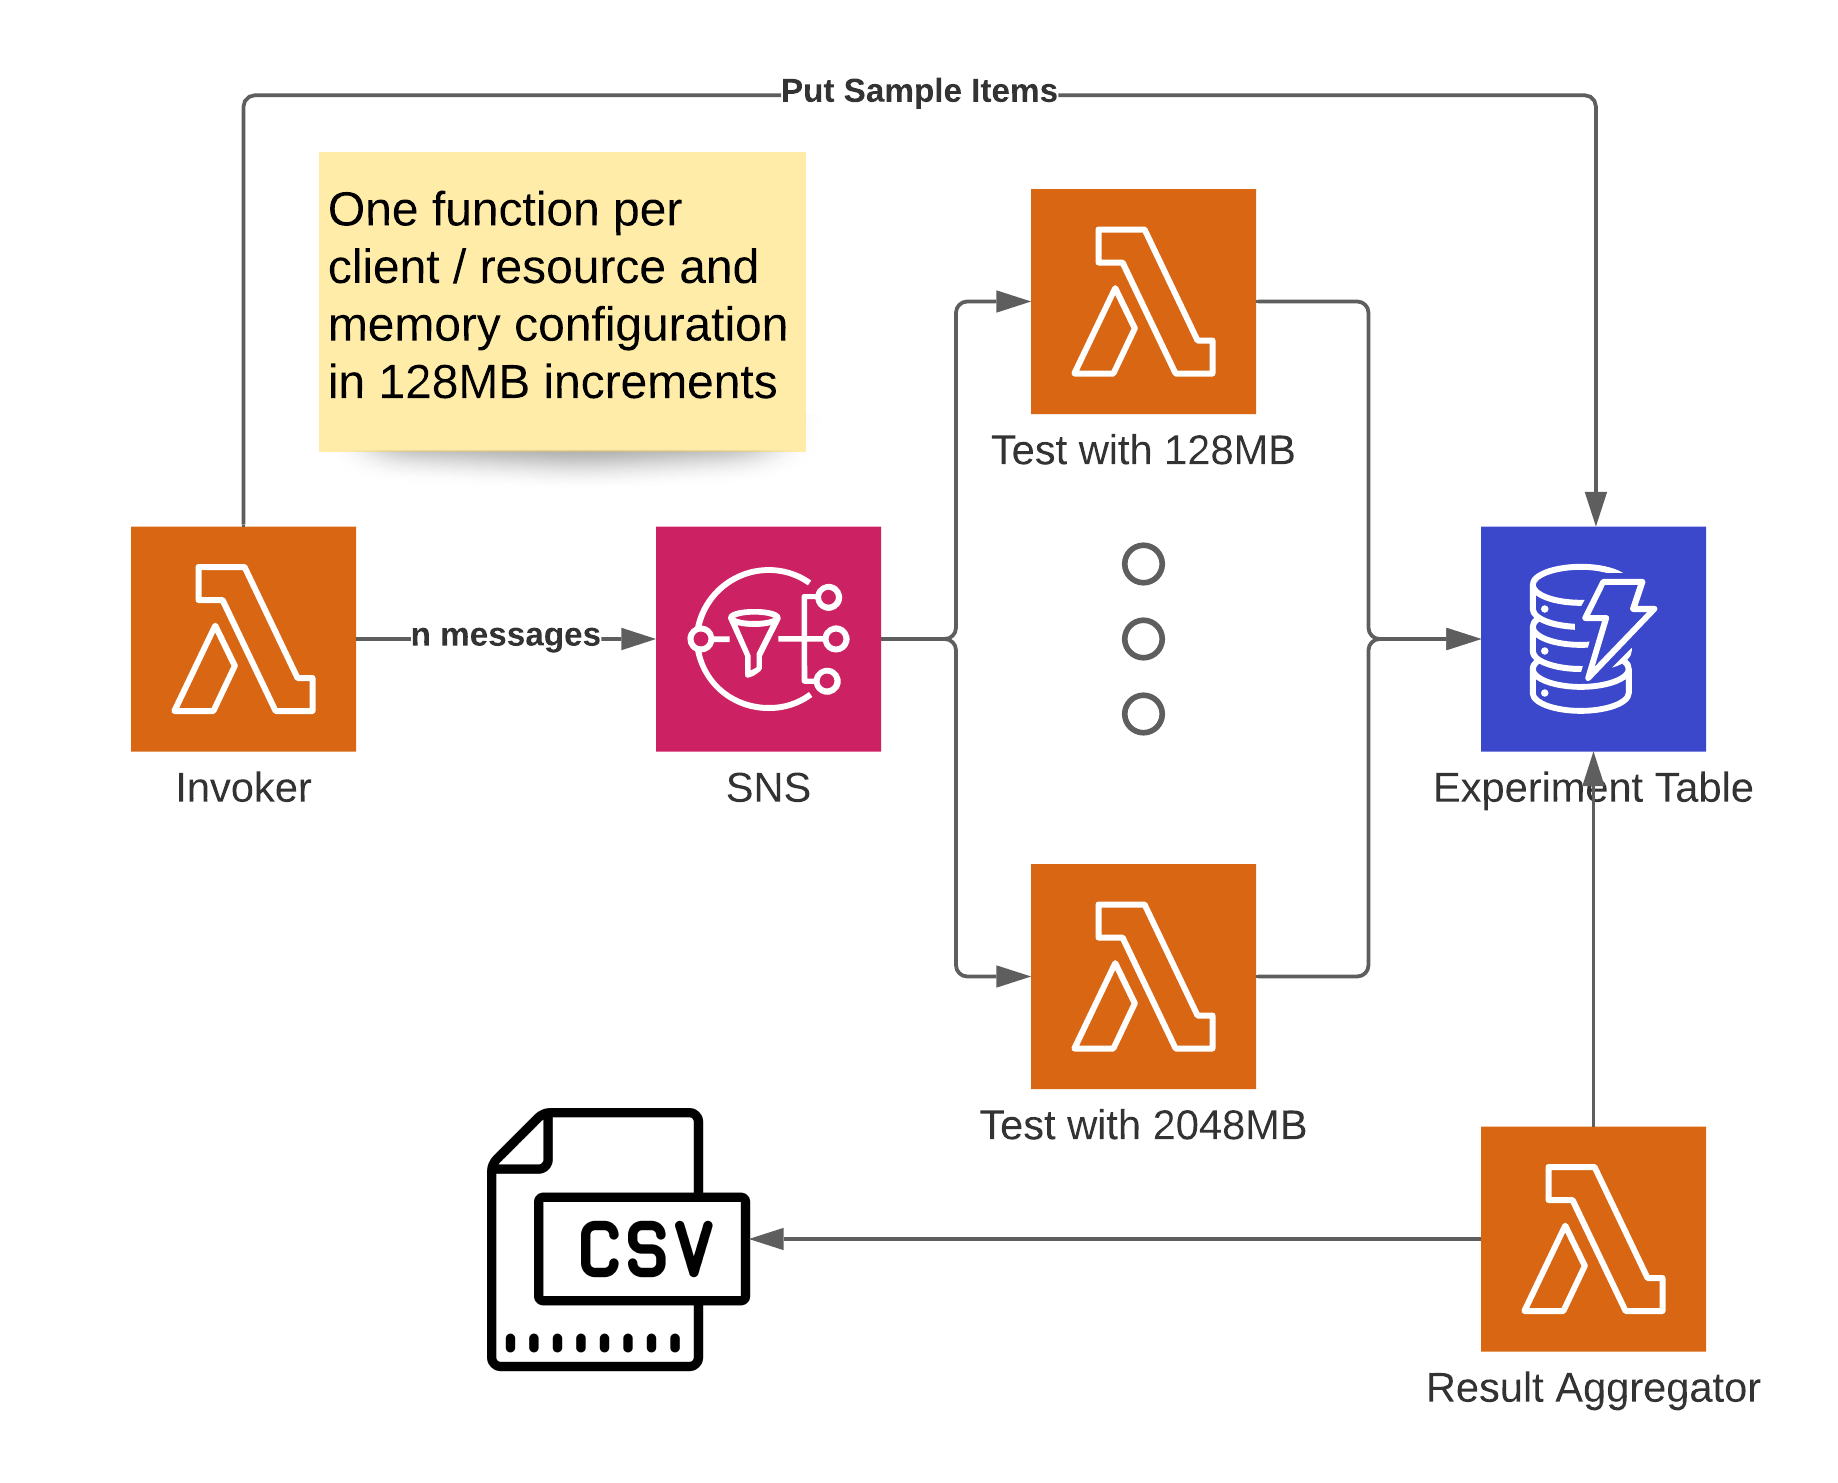
To learn more about which factors impact performance, I built a CDK app for the measurements. You can find it on Github. The general idea is similar to my setup in the previous article for performance measurements.
I created a set of Lambda functions with different memory configurations, one of each for the client and resource APIs. The Lambda functions are triggered through an SNS topic. Each Lambda reads items of different sizes and complexities (nested/flat) from a DynamoDB table and records how long that takes. These measurements are written to the same DynamoDB table, where another Lambda can be used to retrieve them.
This result aggregator calculates the average of all measurements and creates a CSV output. The CSV structure can then be used in Excel to make pretty charts. Since we also need the items to be read in the table, the Lambda function that invokes the whole mechanism also creates and stores them there. After the items are created, the mechanism is invoked by sending messages to the SNS topic.
Each measurement was taken once with the boto3 client API and a second time with the resource API to compare how much overhead the abstraction adds. I didn’t test every item size between 1KB and 400KB, but chose a few that should give a good indication: 4KB, 64KB, 128KB, 256KB and 400KB. I used the DynamoDB item size calculator by Zac Charles to ensure my item sizes were accurate.
To test how much nested and/or flat items impact the response times, I created two kinds of items. One that has a flat data structure and looks something like this:
{
    "PK": {
        "S": "ITEM"
    },
    "SK": {
        "S": "400KB_FLAT"
    },
    "payload": {
        "S": "XXXXXX.... (basically the letter X until the item is 400KB in size"
    }
}
The other was a nested structure with a list like this, where I added enough items to the list to get to the desired size:
{
    "payload": {
        "L": [
            {
                "M": {
                    "action": {
                        "S": "list"
                    },
                    "id": {
                        "S": "123"
                    },
                    "time": {
                        "S": "1614712316"
                    }
                }
            }
        ]
    },
    "PK": {
        "S": "ITEM"
    },
    "SK": {
        "S": "004KB_NESTED"
    }
}
Because establishing the underlying HTTPS connection to DynamoDB takes a little bit of time and only impacts the first read in cold Lambdas, I chose to get rid of that. I achieved this by doing a read on a dummy item right before the actual measurements. That way a connection was already established that could be re-used. I did more than 100 measurements for each combination of item-size, item-type, lambda-memory configuration and client/resource api.
Since I used on-demand capacity on my table, I had to add a little delay before starting each measurement. On-Demand scaling is fast, but there are still limitations to how quickly it can ramp up from zero to a couple thousand RCUs and I was getting throttled without the delay.
Let’s now take a look at the results.
Results
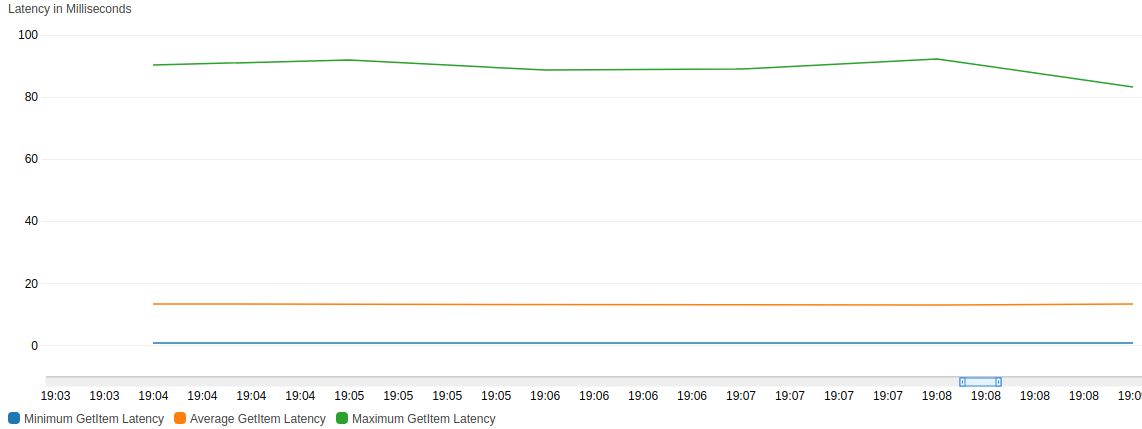
Below you can see a chart from CloudWatch detailing the latency of the GetItem API call during my experiment.
You can see that it took on average less than 20ms across all item sizes I tested.
There is however a wide range between minimum (almost 0 ms) and maximum (around 90ms).
As we shall see later, this isn’t a big factor in the results.
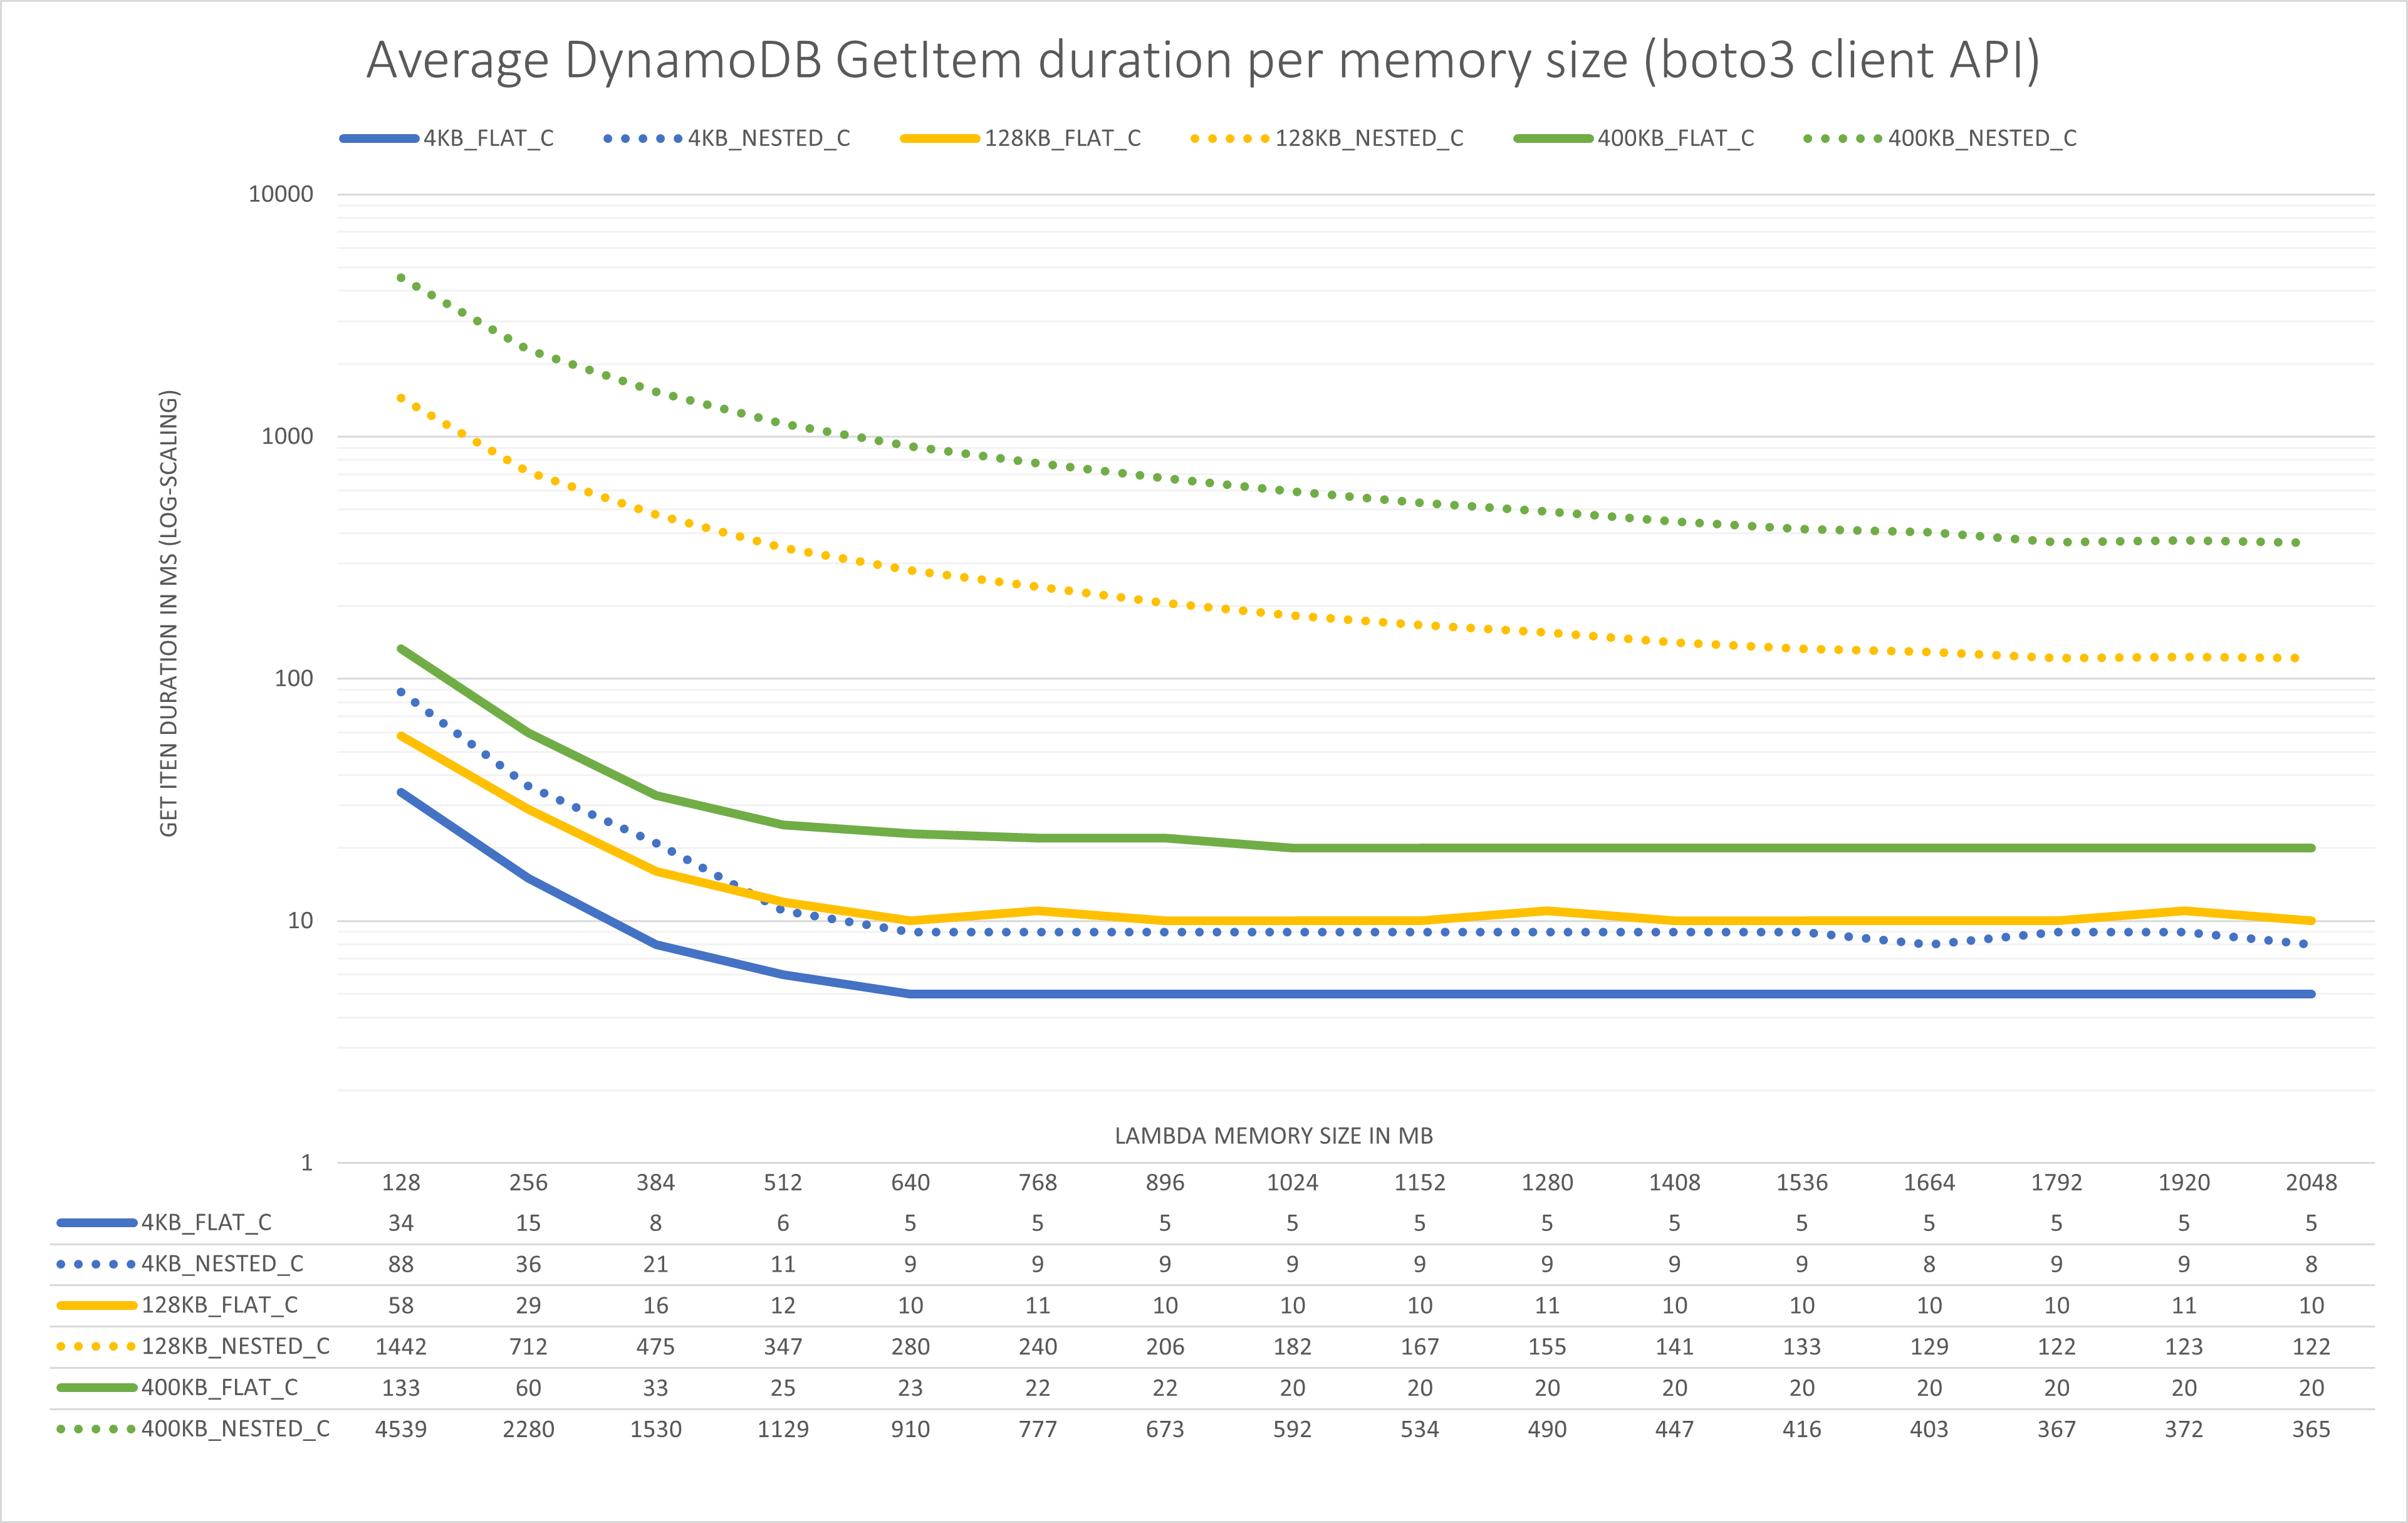
This next chart shows how long the GetItem calls took using the client API for different Lambda sizes.
There is a lot going on here, so let me explain.
- Each color is a different item size.
- The dotted lines are the read times for the nested items and the regular lines for the flat items (item-types).
- The x-axis shows the different memory configurations from 128 MB all the way up to 2048 MB.
- I’ve charted a subset of the item sizes I checked, the full results are in the repository.
- Below the chart you can see a data table with the actual numbers in milliseconds.
- The y-axis is log-scaled, that means after each thick line the units increase by a factor of 10. This is the only way to make this somewhat readable.
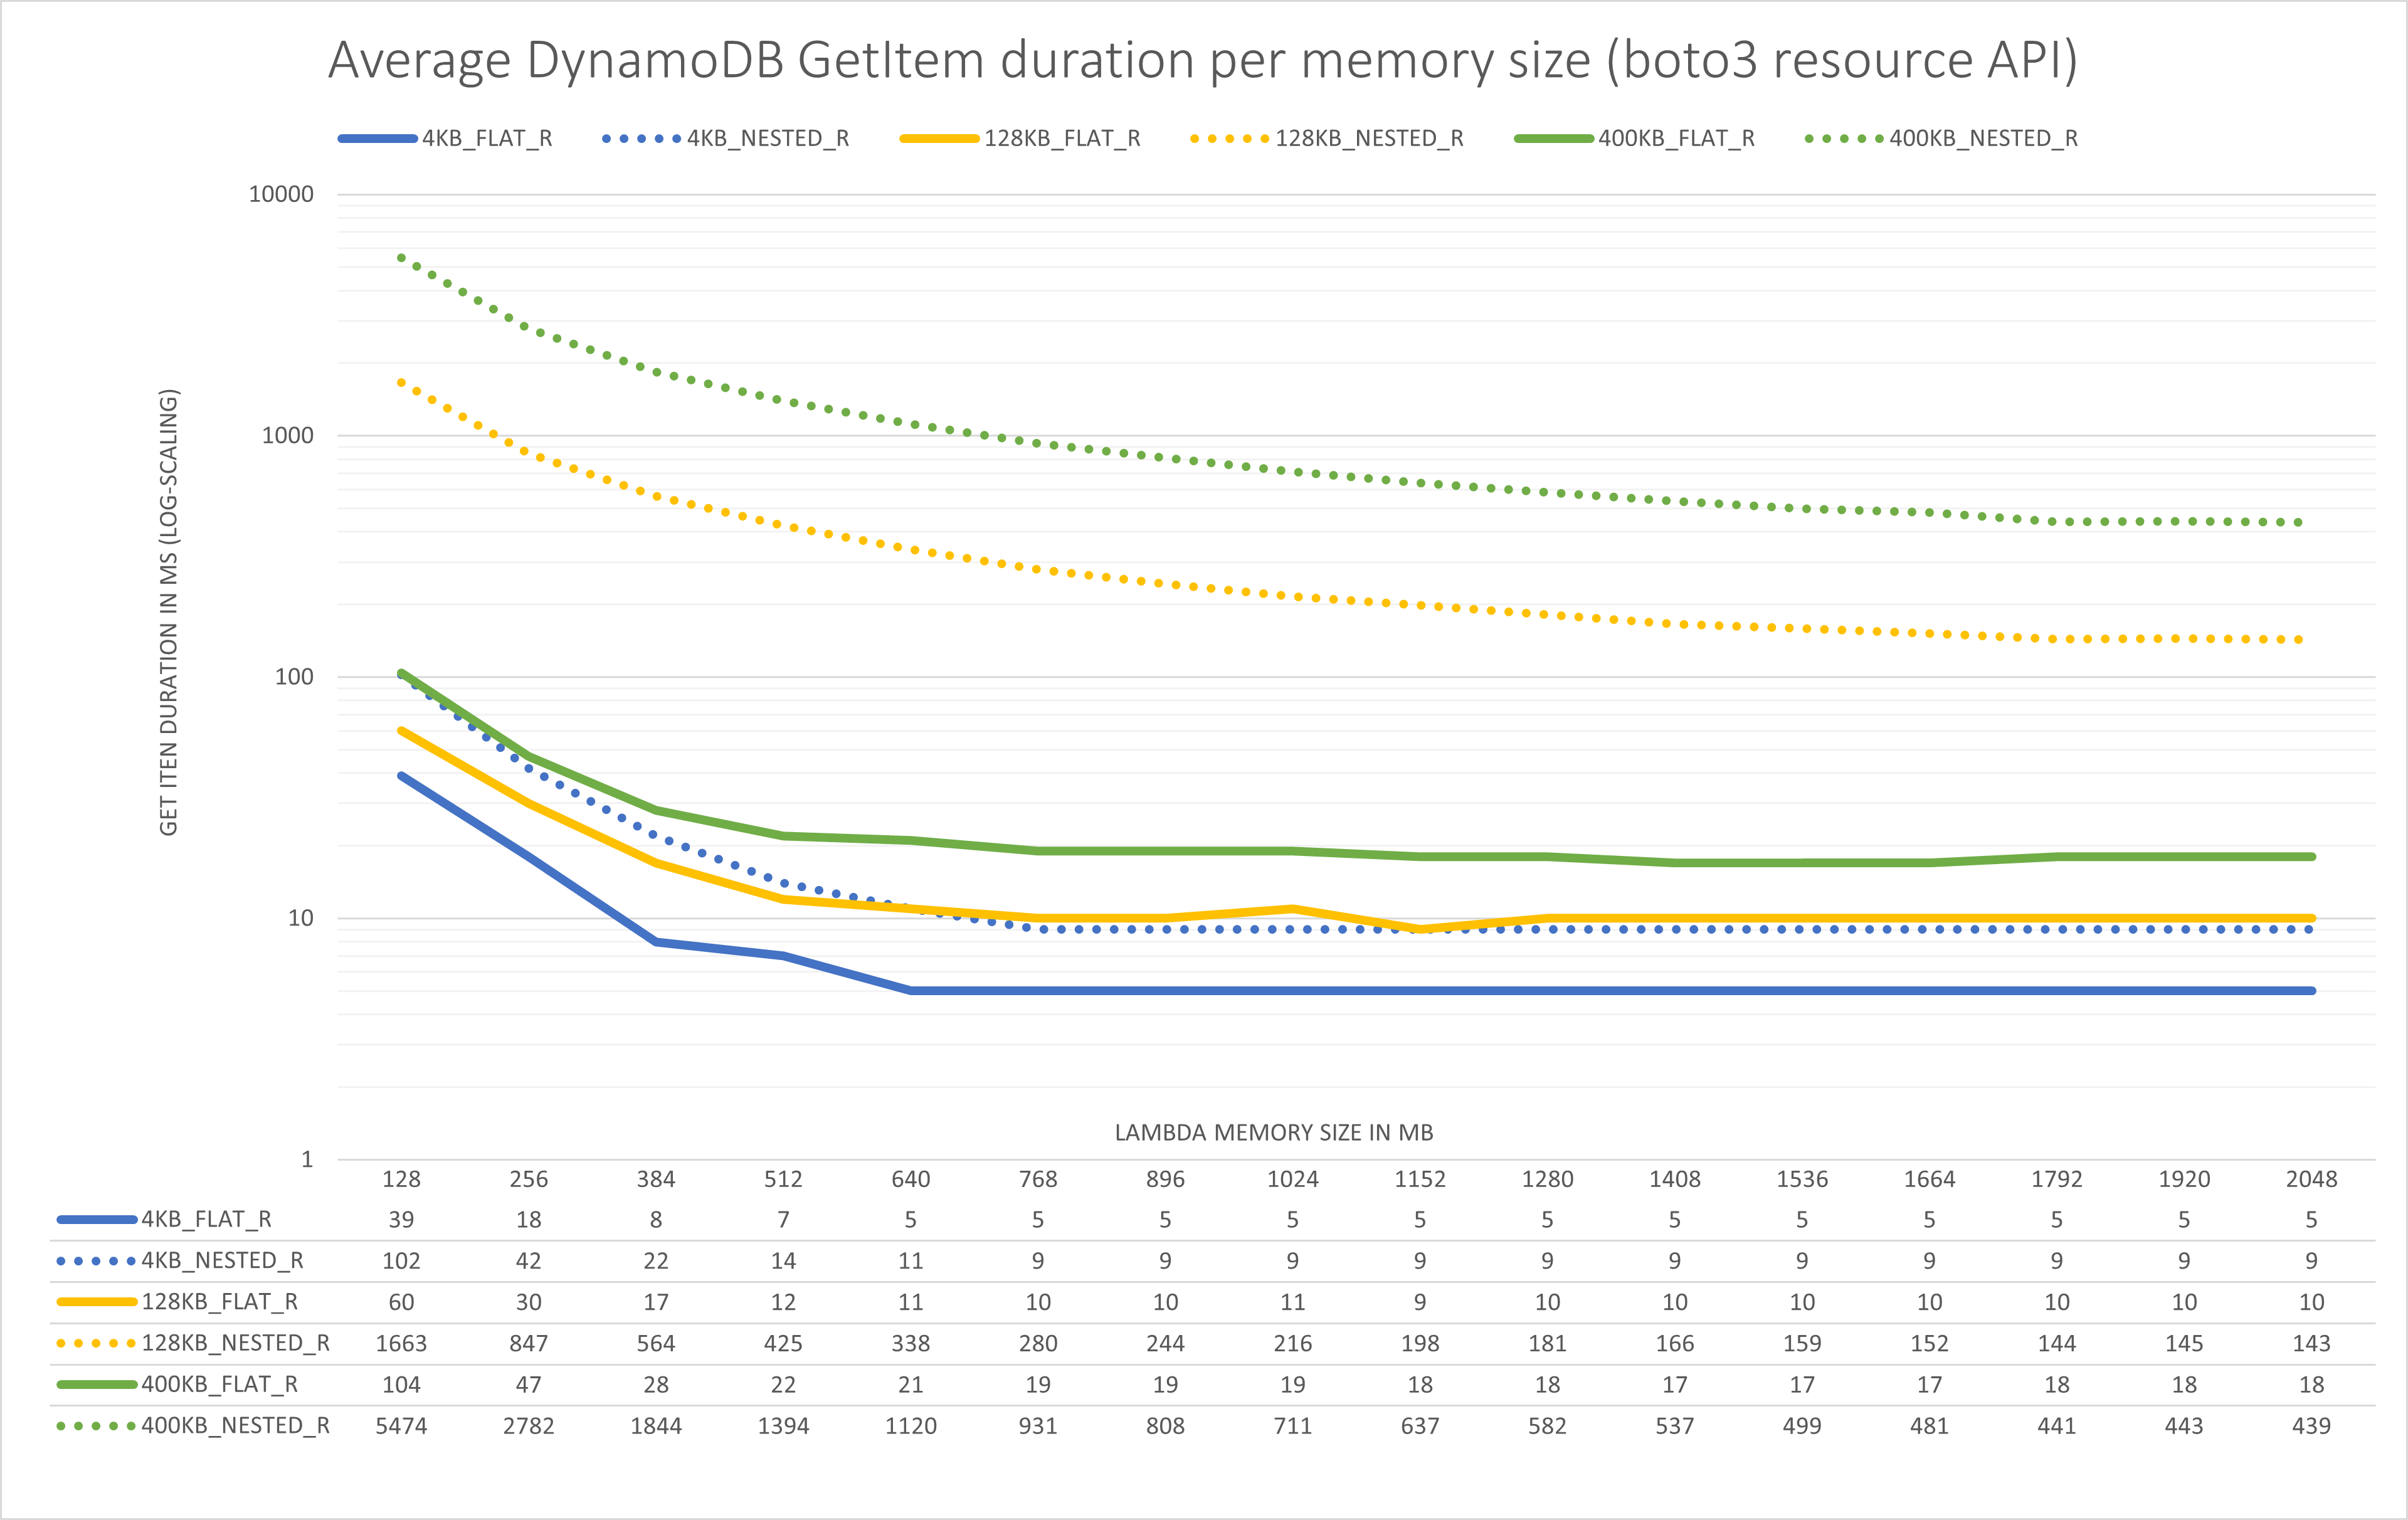
The second chart shows the same numbers for GetItem calls with the resource API.
After seeing the substantial response times, I also measured how long it takes to deserialize the 400 KB nested and flat json-structures using the regular json.loads function in different memory configurations.
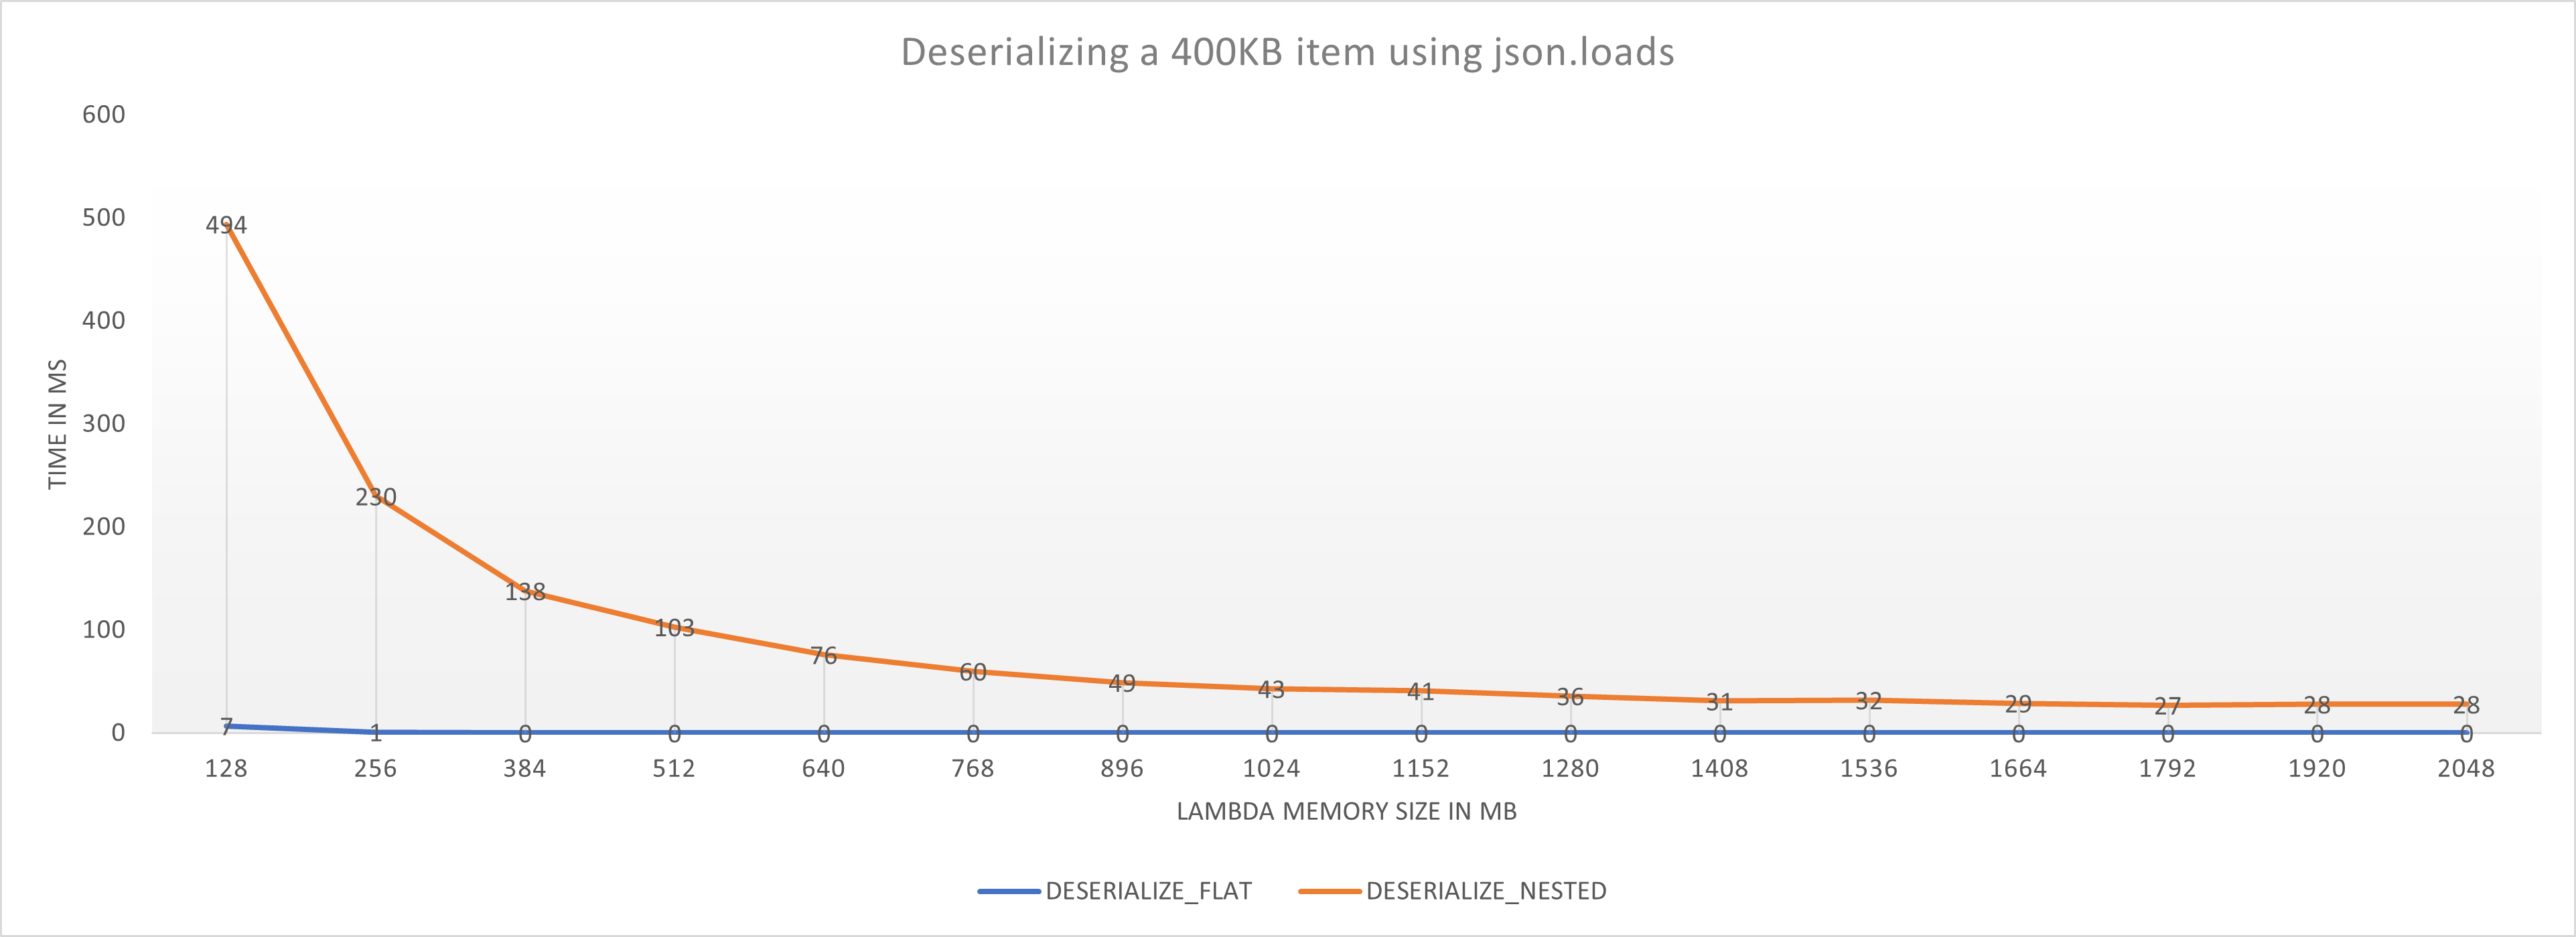
Conclusions
We can learn a few things from this:
- Reading the nested 400 KB item takes up to 34 times longer than the flat structure for the 128 MB Lambda. For the larger Lambdas that’s still a factor of about 18.
- We can read the same large nested item about 12 times faster with a big Lambda (2048 MB) than a small Lambda (128MB) - this doesn’t scale linearly though, because the Lambda is also 16 times more expensive.
- boto3 takes a long time to process nested DynamoDB structures and this is a compute intensive process - memory utilization was well below the maximum. Remember that the maximum response time of the table was around 90ms and we still take 365ms to deserialize the item with a large Lambda function.
- The
resourceAPI adds an overhead of about 20% for large complex items (400KB, nested), for smaller items (4KB, nested) that drops down to about 12% - Deserializing the JSON response from DynamoDB takes up about 7-10% of the run time for the
clientAPI and even less for theresourceAPI. I first suspected this might be a major factor, but it doesn’t look like it. For the flat structures the deserialization time is negligible.
The main takeaway is that large nested DynamoDB structures aren’t cheap. Neither in terms of WCUs/RCUs nor in terms of performance. It may be better to unnest them into separate items in a single collection and selectively access them. Also slow performance when reading from DynamoDB might be the result of undersized Lambda functions.
If you have enjoyed this performance analysis, you might also like the one I did on the impact of boto3 on cold start times. Aside from that, this is it. For questions, concerns and feedback, feel free to reach out to me via the social media channels listed in my bio below.
— Maurice