Analyzing CloudWatch Costs
This content is more than 4 years old and the cloud moves fast so some information may be slightly out of date.
Problem
Amazon CloudWatch is a managed service for storing, visualizing and analyzing logs and metrics data of applications and AWS infrastructure. The service is simple to configure and use and is priced based on usage. Thus, adoption is generally both easy and cheap compared to other tools such as Splunk, ElasticSearch, Datadog, and all the others out there.
Upon heavy usage, it can become quite expensive though. Customers trying to reduce their CloudWatch costs may find that the cause of high CloudWatch charges is a bit intransparent. This post summarizes some common cost drivers in CloudWatch and proposes strategies to identify these and reduce their costs.
Identifying cost drivers
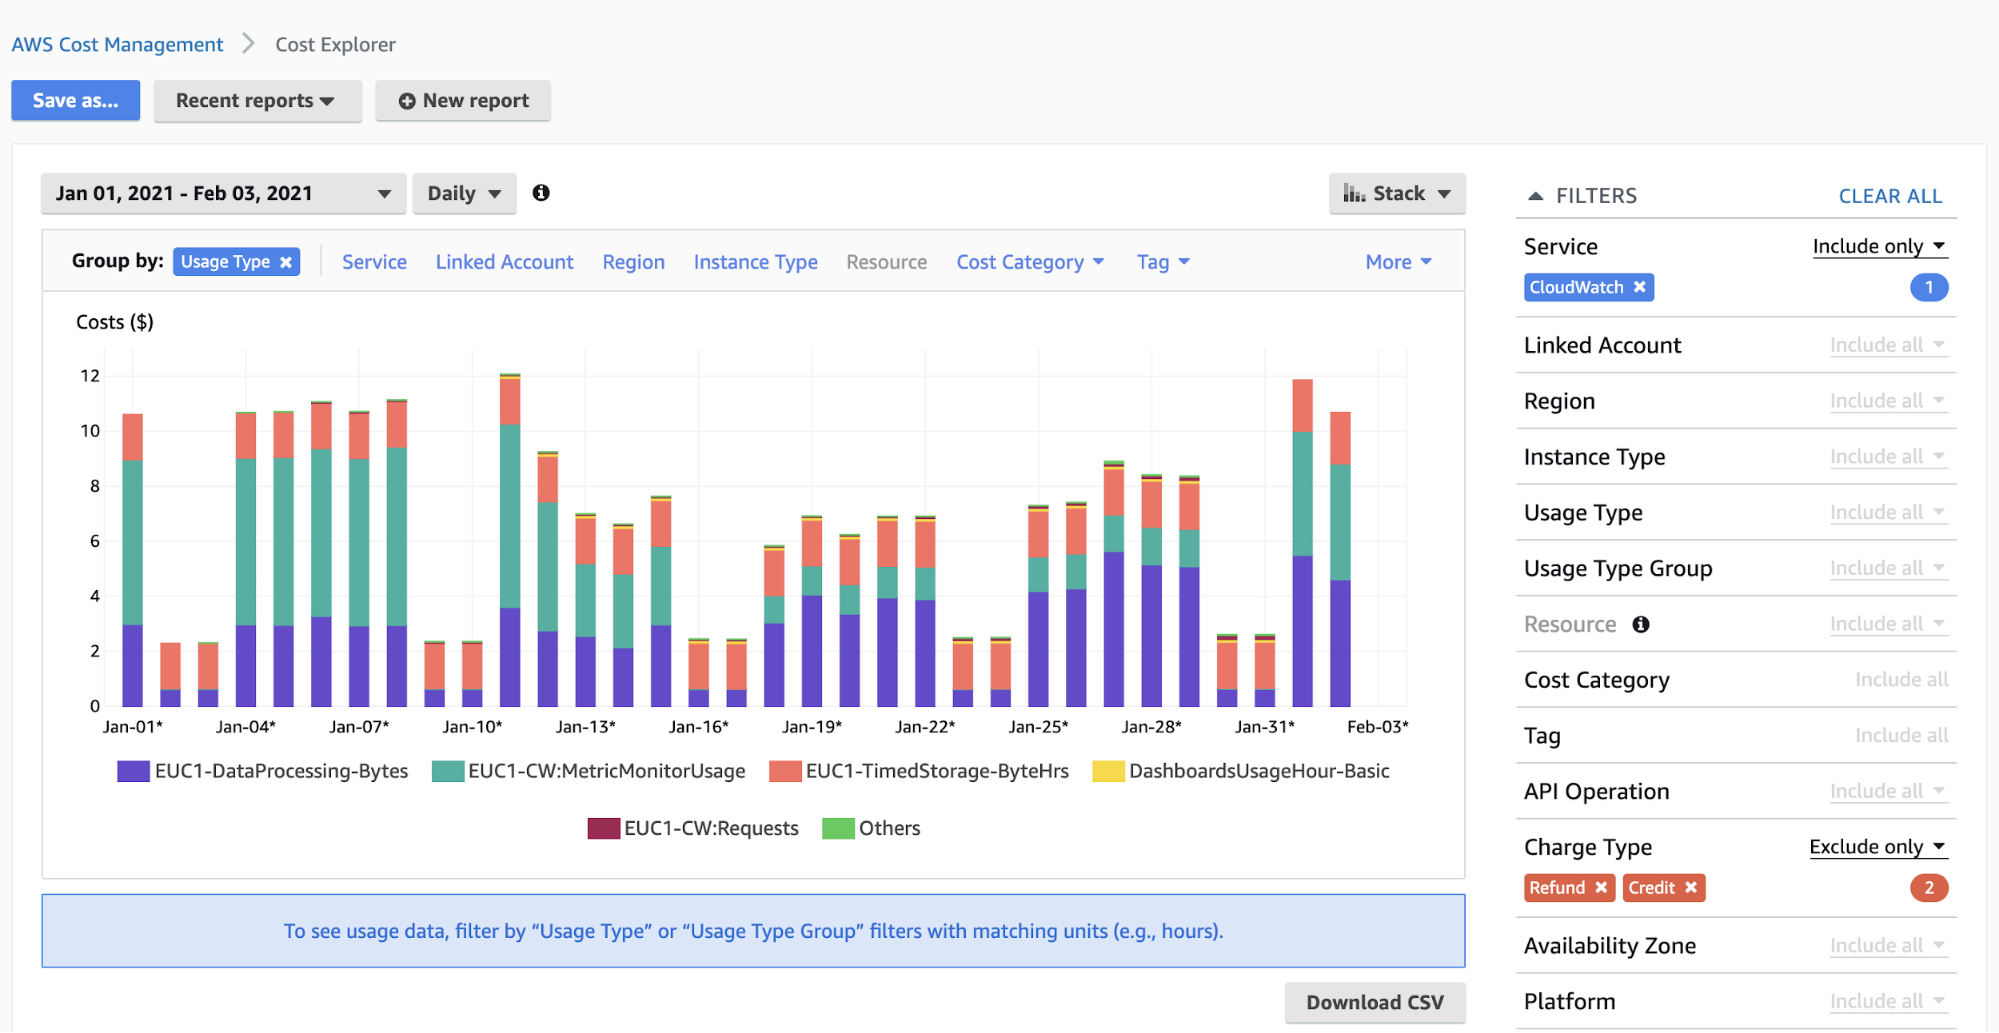
Before we can start with our cost analysis, we need to gather some information about our current CloudWatch costs. In your AWS account, go to AWS Cost Explorer, hit Explore Costs, filter Service by CloudWatch in the filter panel on the right-hand side, and group by usage type on top of the chart. If you want to, also select a time range. When you’re done, hit the Export CSV button.
Note: The downloaded information is available in the Cost Explorer console as well, however during my examinations I found that analyzing that information is more convenient in Excel. You can skip downloading and modifying the file and instead just scroll to the very right column in the table underneath the chart pictured below. The last column shows the aggregated costs by usage type in the select timeframe.
After downloading the CSV file, open it in Excel and convert text to columns. The delimiter is a comma. Depending on your residence, you might have to switch the decimal and thousand separators as well, because the export file from AWS cost explorer is formatted in American syntax:
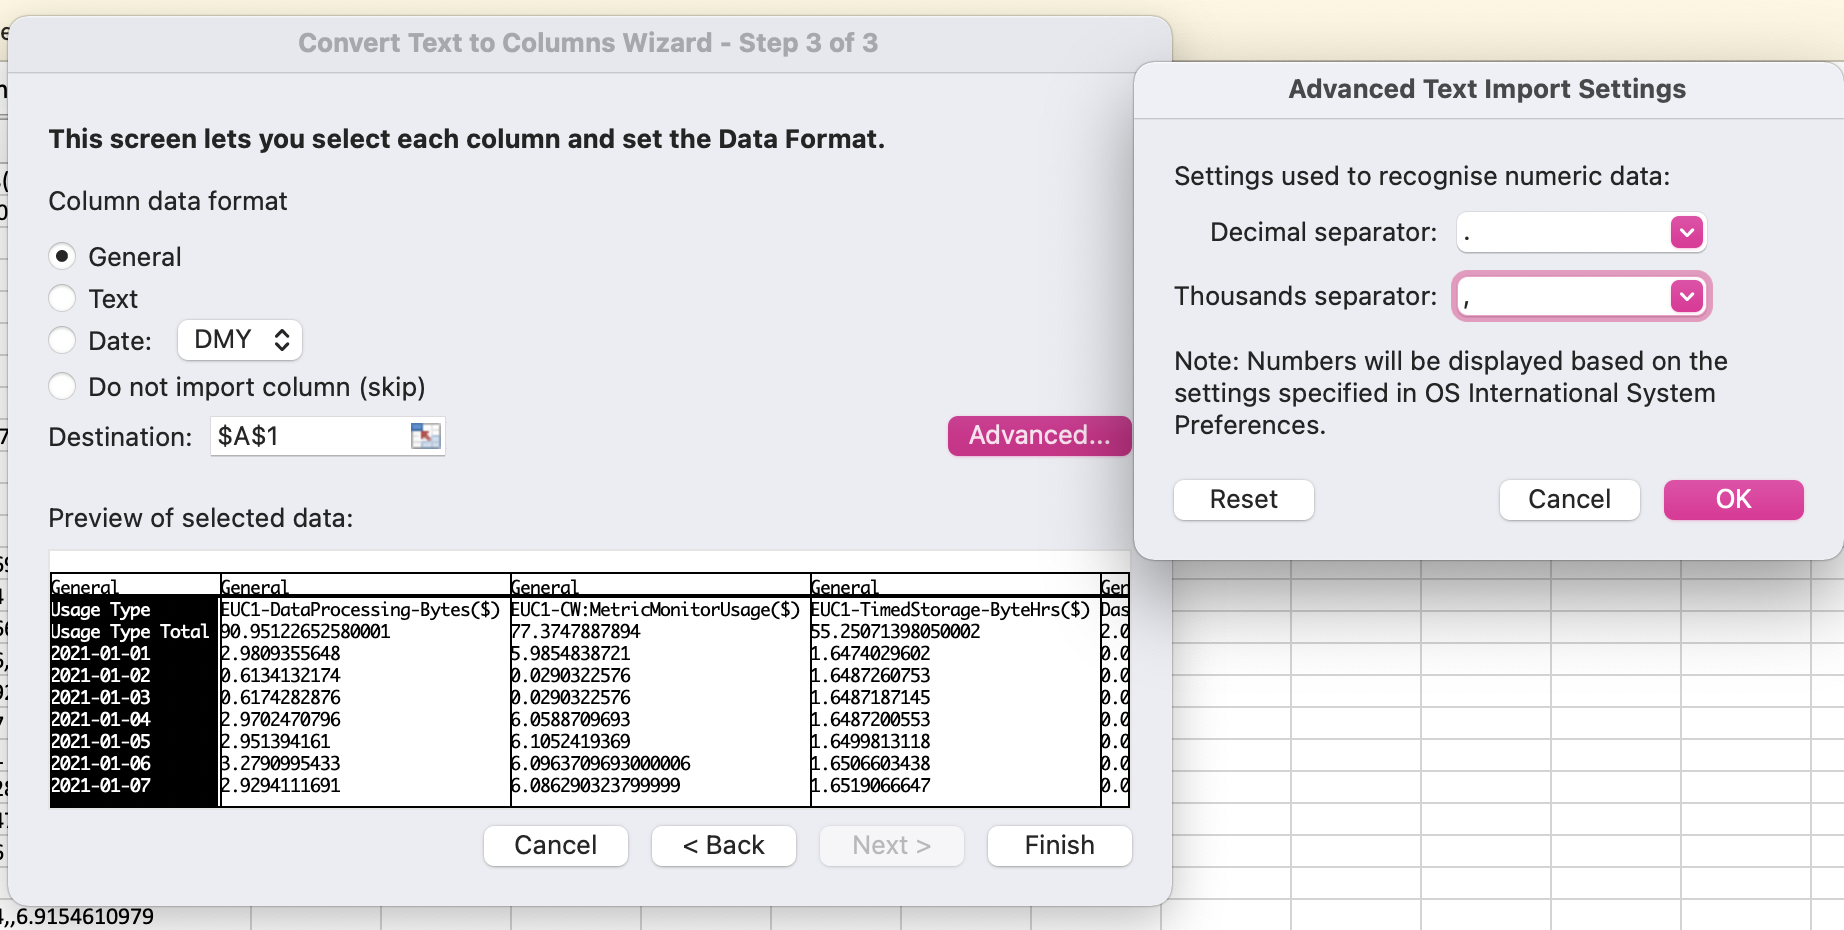
The result is an Excel file that lists CloudWatch usage types in the first line and the corresponding costs in the second line in the timeframe you selected earlier and in descending order.
But what do these usage types mean? And how can I reduce usage?
Cost Analysis
Let’s dig deeper. The remainder of this article will explain usage types that are likely to be among the most expensive ones on your AWS bill and provide strategies for identifying resources that are most expensive.
Prerequisites and Disclaimers
Amazon CloudWatch pricing is explained on the official pricing website.
The prices mentioned in this article are from the eu-central-1 (Frankfurt) region. As for all AWS services, pricing can differ between AWS regions. However, the general pricing structure remains the same across regions, so the information provided here can be applied to other regions without greater concerns. What is more, prices can change over time so by the time you are reading this, the numbers might have changed. Free tiers as well as price reductions for higher volumes are not taken into account either.
Simply put, this post really isn’t about numbers, but rather about the methodology that I found useful and efficient.
Besides the pricing page, another useful source is this article from the AWS knowledge center, which gives rudimentary descriptions of the different CloudWatch usage types.
Since the CloudWatch service is continuously evolving, that page does not cover all usage types, nor does this blog post (especially not the features that will be launched in the future).
Other handy tools for further analysis are:
- AWS CLI
- json-csv.com - or any other tool that does the trick
- Excel
Analyzing CloudWatch Usage Types
CW:MetricMonitorUsage
Origin: Custom Metrics stored in CloudWatch Metrics
Pricing:
- Standard metrics for AWS services are mostly for free
- $0.30 per metric per month, PutMetricData $0.01 per 1,000 requests (n/a for EC2 Detailed Monitoring)
- also refer to CW:Requests and CW:GMD-Metrics
Cost Reduction Strategy: As every PutMetricData request costs money, we need to find out which custom metrics have the most data points. With that information, we can reduce the number of metrics, metric dimensions and/or frequency (period) of metrics.
It should be emphasized that the CloudWatch Insights Prometheus Metrics Monitoring can cause very high MetricMonitorUsage when it’s not configured carefully (Reference).
Analysis: Unfortunately, we can’t get that information with a simple AWS CLI command, but there is a blog post by Gonzalo E. Vásquez Sáez and a script for iteratively extracting usage information per metric. Since this usage type is already explained in the other blog post, I’m not going to repeat that information. Just take a look ;-)
DataProcessing-Bytes
Origin: Amount of log event data in CloudWatch Logs
Pricing: $0.63 per GB of log data
Cost Reduction Strategy: Reduce Log Event size and/or amount of data that is written into CloudWatch logs (e.g. by adjusting log level).
Analysis: First, we need to find log groups with high usage by using the AWS CLI. The command below writes the output to a JSON file that can be transformed to CSV and analyzed in Excel afterwards. You might as well just read the output of the CLI command and find the log groups that you use most from that.
aws logs describe-log-groups > loggroups.json
For a given log group, we can even narrow it down to log streams with high usage:
aws logs describe-log-streams \n
--log-group-name MY-LOG-GROUP \n
--query 'logStreams[*].[logStreamName, lastEventTimestamp, storedBytes]' \n
--order-by LastEventTime \n
--max-items 3000 | jq '.[][1] |= (./1000 | strftime("%Y-%m-%d"))' > logstream1.json
If the log group has many log streams, which happens for example in container-based or serverless environments, the CLI command above needs to be limited to a certain amount of log streams using the –max-items parameter (e.g. 3000). You’ll know that the parameter value needs to be decreased if you experience a ThrottlingException.
With that information, you know exactly which applications are writing the most log data, and can start optimizing.
UPDATE July 2020: Unfortunately, the
storedBytesfield used in the example above has been deprecated by AWS. Therefore, the described way for identifying large log streams is not feasible any more. An alternative approach is to use CloudWatch Insights to sum up the log message sizes per log group:
fields @logStream
| stats sum(strlen(@message)) as size by @logStream
| sort size desc
| limit 20
Make sure to select a small yet representative timeframe (e.g. 1h during peak hours) for the insights query to get good data but keep costs for the query execution low.
TimedStorage-ByteHrs
Origin: Stored logs per Hour per Byte in CloudWatch Logs
Pricing: $0.0324 per GB
Cost Reduction Strategy: Same as for DataProcessing-Bytes, we can decrease costs by reducing log event size and/or amounts of log events. Furthermore, reduction of the log retention period will save you some money, too. If you need long-term storage of log data, think about exporting data to S3/Glacier instead of keeping it in CloudWatch Logs for a long time.
Analysis: Same as DataProcessing-Bytes
VendedLog-Bytes
Origin:
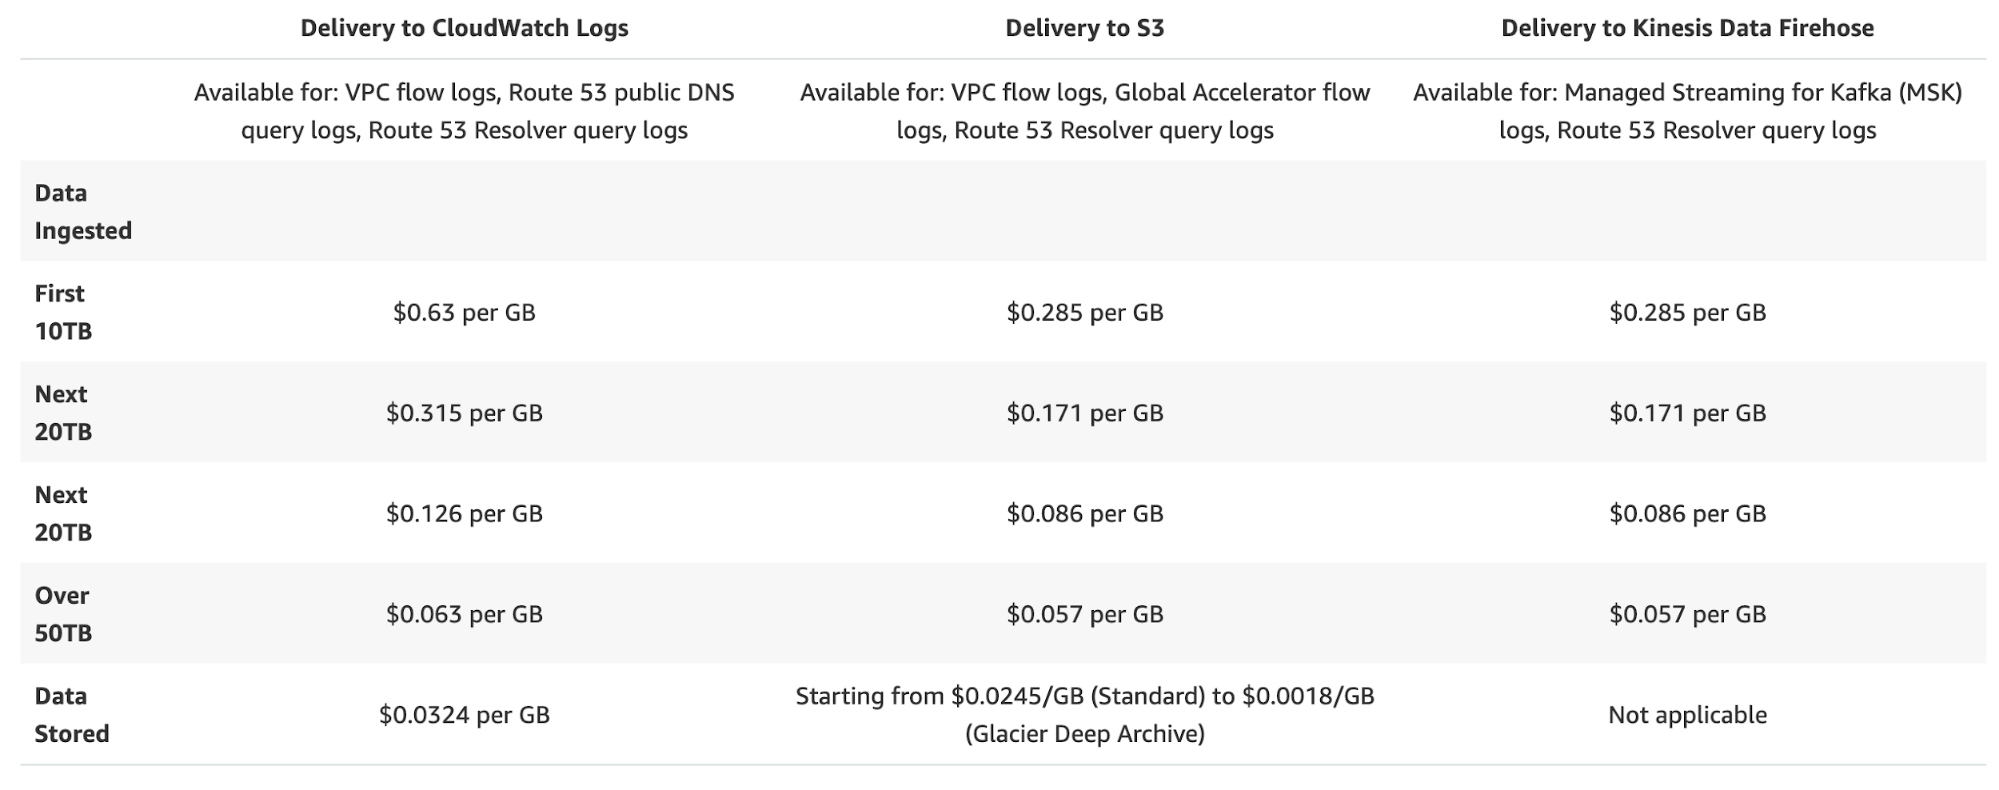
Vended logs are specific AWS service logs natively published by AWS services on behalf of the customer and available at volume discount pricing. Supported service logs include: Amazon VPC flow logs, AWS Global Accelerator flow logs, Managed Streaming for Kafka (MSK) broker logs, Amazon Route 53 public DNS query logs, and Amazon Route 53 Resolver query logs. Vended logs can be delivered to one or more of the following destinations: CloudWatch Logs, Amazon S3, or Amazon Kinesis Data Firehose.
(from: CloudWatch Pricing)
Pricing: Data Ingestion (similar to DataProcessing-Bytes)
Cost Reduction Strategy: Same as DataProcessing-Bytes
Analysis: Same as DataProcessing-Bytes
CW:Requests and CW:GMD-Metrics
Origin: Metrics API Calls (CloudWatch Metrics)
Pricing: $0.01 per 1,000 metrics requested ($0.02 per 1,000 metrics requested for GetMetricWidgetImage)
Cost Reduction Strategy:
- Are all custom metrics required / can they be downsized in terms of frequency or dimensions?
- (if external tools are accessing data in CloudWatch Metrics:) Are there any configurations in external tools that can be made to decrease the number of API calls?
Analysis:
- Are there any custom metrics that are written via the PutMetricData API Call (refer to CW:MetricMonitorUsage)
- Are there any applications such as external monitoring tools that access the CloudWatch API?
DataScanned-Bytes
Origin: Queries in CloudWatch Insights
Pricing: $0.0063 per GB of data scanned
Cost Reduction Strategy: Implement limits and use precise time filters to reduce the amount of data scanned by your queries.
Analysis: This one is hard to analyze because the amount of scanned data is not available in the query history. However, with the following CLI command, we can find queries that run frequently:
aws logs describe-queries
We can use that information to execute frequently used queries once again for cost analysis purposes to determine how much data they scan.
DashboardsUsageHour-Basic
Origin: CloudWatch Dashboards
Pricing: $3.00 per dashboard per month
Cost Reduction Strategy:
- Dashboards often get stale and replaced by others. Some of your dashboards are probably not used by anyone.
- Predefined dashboards are available (Container Insights, Lambda Insights, Metrics Explorer) and may serve your needs
Analysis: Check if dashboards are still needed.
S3-Egress-Bytes($)
Origin: VPC flow logs, Global Accelerator flow logs, Route 53 Resolver query logs that are configured to be delivered into S3. This is in fact not related to the CloudWatch service, but it may appear on your CloudWatch bill anyway.
Pricing:
- Ingestion is charged at $0.25 per GB (see VendedLog-Bytes)
- Storage is subject to S3 pricing ($0.023 per GB) (CloudWatch Pricing)
Cost Reduction Strategy: VPC flow logs can produce quite a lot of data in large AWS environments. Whilst they are helpful for analyzing network issues, you may want to consider whether flow logs are required in (a) CloudWatch logs and (b) S3. If you have configured both, you pay twice for every flow log event. Generally, sending flow logs to S3 and analyzing them with Athena when needed is cheaper.
(refer to: this post by AWS Premium Support for details.)
Analysis: Is flow log archival to S3 necessary?
CW:AlarmMonitorUsage
Origin: CloudWatch Alarms
Pricing: $0.10 per alarm metric in standard resolution (60s), $0.30 per alarm metric in high resolution (10s)
Cost Reduction Strategy: Similar to dashboards: Alarms often get stale and replaced by others. Some of your dashboards are probably not used by anyone.
Analysis: Check if alarms are still needed.
Conclusion
Despite being cheaper than other tools for logs / metrics storage and analysis in the beginning, CloudWatch can grow to a substantial position on your AWS bill. If that happens, it’s definitely time to optimize. As it’s not trivial task to determine CloudWatch cost drivers, this blog post hopefully gives you some guidance on gathering the information you need and drawing the right conclusions. Hope it helps!